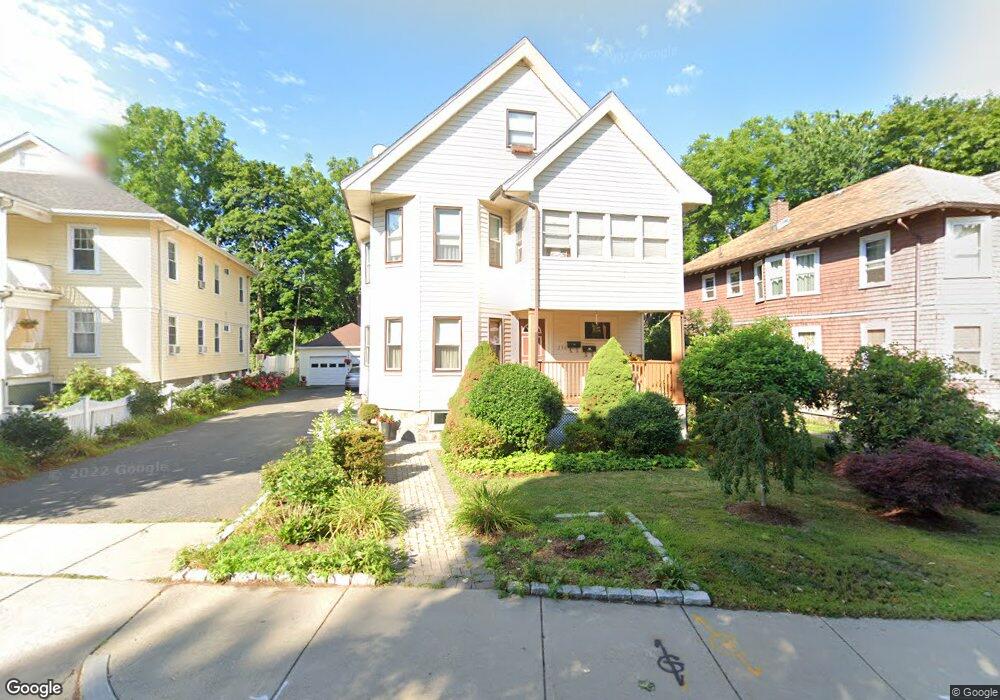
258 Corey St West Roxbury, MA 02132
West Roxbury NeighborhoodEstimated Value: $1,020,000 - $1,235,000
6
Beds
2
Baths
2,631
Sq Ft
$436/Sq Ft
Est. Value
About This Home
This home is located at 258 Corey St, West Roxbury, MA 02132 and is currently estimated at $1,148,325, approximately $436 per square foot. 258 Corey St is a home located in Suffolk County with nearby schools including Holy Name Parish School, St Theresa School, and The Roxbury Latin School.
Ownership History
Date
Name
Owned For
Owner Type
Purchase Details
Closed on
May 18, 2020
Sold by
Jomides Simela
Bought by
Jomides Konstas Ft
Current Estimated Value
Purchase Details
Closed on
Nov 25, 2013
Sold by
Konstas Parthena
Bought by
Konstas Parthena and Konstas George
Create a Home Valuation Report for This Property
The Home Valuation Report is an in-depth analysis detailing your home's value as well as a comparison with similar homes in the area
Home Values in the Area
Average Home Value in this Area
Purchase History
| Date | Buyer | Sale Price | Title Company |
|---|---|---|---|
| Jomides Konstas Ft | -- | None Available | |
| Konstas Parthena | -- | -- |
Source: Public Records
Tax History Compared to Growth
Tax History
| Year | Tax Paid | Tax Assessment Tax Assessment Total Assessment is a certain percentage of the fair market value that is determined by local assessors to be the total taxable value of land and additions on the property. | Land | Improvement |
|---|---|---|---|---|
| 2025 | $11,490 | $992,200 | $484,500 | $507,700 |
| 2024 | $9,979 | $915,500 | $369,600 | $545,900 |
| 2023 | $9,189 | $855,600 | $345,400 | $510,200 |
| 2022 | $9,038 | $830,700 | $335,400 | $495,300 |
| 2021 | $8,864 | $830,700 | $335,400 | $495,300 |
| 2020 | $8,540 | $808,700 | $287,600 | $521,100 |
| 2019 | $8,059 | $764,600 | $240,700 | $523,900 |
| 2018 | $7,491 | $714,800 | $240,700 | $474,100 |
| 2017 | $7,210 | $680,800 | $240,700 | $440,100 |
| 2016 | $7,201 | $654,600 | $240,700 | $413,900 |
| 2015 | $6,719 | $554,800 | $221,400 | $333,400 |
| 2014 | $6,274 | $498,700 | $221,400 | $277,300 |
Source: Public Records
Map
Nearby Homes
- 37 Pomfret St
- 19 Pomfret St
- 168 Maple St
- 701 Vfw Pkwy
- 5 Crest St
- 37 Hastings St Unit 103
- 76 Redlands Rd
- 102 Greaton Rd
- 97 Anderer Ln Unit 105
- 9 Carroll St
- 539 Lagrange St
- 79 Potomac St
- 857 Vfw Pkwy
- 1789 Centre St Unit 202
- 865 Lagrange St Unit 5
- 110 Park St Unit 3
- 331 Vermont St
- 139 Newfield St
- 22 Bellevue St
- 577 Baker St Unit 577