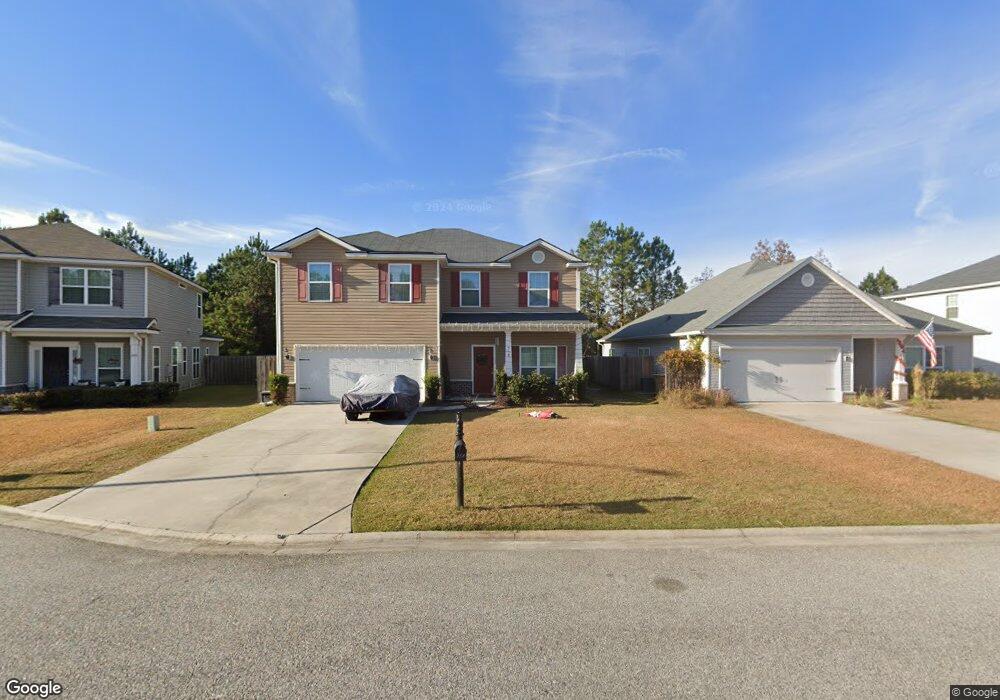
258 Cypress Creek Ln Guyton, GA 31312
Estimated Value: $387,592 - $415,000
--
Bed
--
Bath
2,719
Sq Ft
$149/Sq Ft
Est. Value
About This Home
This home is located at 258 Cypress Creek Ln, Guyton, GA 31312 and is currently estimated at $404,148, approximately $148 per square foot. 258 Cypress Creek Ln is a home with nearby schools including South Effingham Elementary School, South Effingham Middle School, and South Effingham High School.
Ownership History
Date
Name
Owned For
Owner Type
Purchase Details
Closed on
Jul 24, 2015
Sold by
Ernest Signature Custom Ho
Bought by
Cribbs James R and Cribbs Katie S
Current Estimated Value
Home Financials for this Owner
Home Financials are based on the most recent Mortgage that was taken out on this home.
Original Mortgage
$204,639
Outstanding Balance
$159,679
Interest Rate
4.04%
Mortgage Type
New Conventional
Estimated Equity
$244,469
Purchase Details
Closed on
May 13, 2015
Sold by
Clover Pointe Development
Bought by
Ernest Signature Custom Llc
Home Financials for this Owner
Home Financials are based on the most recent Mortgage that was taken out on this home.
Original Mortgage
$168,000
Interest Rate
3.79%
Mortgage Type
New Conventional
Purchase Details
Closed on
Mar 13, 2015
Sold by
Clover Pointe Development Llc
Bought by
Ernest Signature Custom Homes Llc
Create a Home Valuation Report for This Property
The Home Valuation Report is an in-depth analysis detailing your home's value as well as a comparison with similar homes in the area
Home Values in the Area
Average Home Value in this Area
Purchase History
| Date | Buyer | Sale Price | Title Company |
|---|---|---|---|
| Cribbs James R | $215,410 | -- | |
| Ernest Signature Custom Llc | $37,000 | -- | |
| Ernest Signature Custom Homes Llc | $37,000 | -- |
Source: Public Records
Mortgage History
| Date | Status | Borrower | Loan Amount |
|---|---|---|---|
| Open | Cribbs James R | $204,639 | |
| Previous Owner | Ernest Signature Custom Llc | $168,000 |
Source: Public Records
Tax History Compared to Growth
Tax History
| Year | Tax Paid | Tax Assessment Tax Assessment Total Assessment is a certain percentage of the fair market value that is determined by local assessors to be the total taxable value of land and additions on the property. | Land | Improvement |
|---|---|---|---|---|
| 2025 | $3,776 | $153,506 | $22,800 | $130,706 |
| 2024 | $3,776 | $148,854 | $22,800 | $126,054 |
| 2023 | $2,670 | $144,939 | $18,800 | $126,139 |
| 2022 | $3,191 | $128,362 | $18,000 | $110,362 |
| 2021 | $3,121 | $104,803 | $17,000 | $87,803 |
| 2020 | $3,062 | $98,388 | $17,000 | $81,388 |
| 2019 | $3,080 | $98,388 | $17,000 | $81,388 |
| 2018 | $3,066 | $96,006 | $16,000 | $80,006 |
| 2017 | $3,067 | $95,206 | $15,200 | $80,006 |
| 2016 | $2,669 | $88,084 | $16,000 | $72,084 |
| 2015 | -- | $7,600 | $7,600 | $0 |
Source: Public Records
Map
Nearby Homes
- 172 Green Paddock Cir
- 162 Saddleclub Way
- 116 Bluegrass Cir
- 217 Cypress Creek Ln
- 103 Brindlewood Dr
- 257 Cypress Creek Ln
- 118 Red Maple Ln
- 193 Saddleclub Way
- 137 Saddleclub Way
- 154 Clover Point Cir
- 158 Clover Point Cir
- 105 Liam Ct
- 0 Hodgeville Rd Unit SA341541
- 0 Hodgeville Rd Unit 10622997
- 219 Haisley Run
- 239 Haisley Run
- New Haven Town A Plan at Belmont Glen - New Haven Townhomes
- Madison Plan at Belmont Glen - New Haven Single Family
- New Haven Town B Plan at Belmont Glen - New Haven Townhomes
- Hudson Plan at Belmont Glen - New Haven Single Family
- 256 Cypress Creek Ln
- 260 Cypress Creek Ln
- 262 Cypress Creek Ln
- 253 Cypress Creek Ln
- 111 Smithwick Trail
- 255 Cypress Creek Ln
- 259 Cypress Creek Ln
- 109 Smithwick Trail
- 113 Smithwick Trail
- 250 Cypress Creek Ln
- 107 Smithwick Trail
- 115 Smithwick Trail
- 117 Smithwick Trail
- 246 Cypress Creek Ln
- 103 Smithwick Trail
- 108 Smithwick Trail
- 119 Smithwick Trail
- 243 Cypress Creek Ln
- 110 Smithwick Trail
- 106 Smithwick Trail