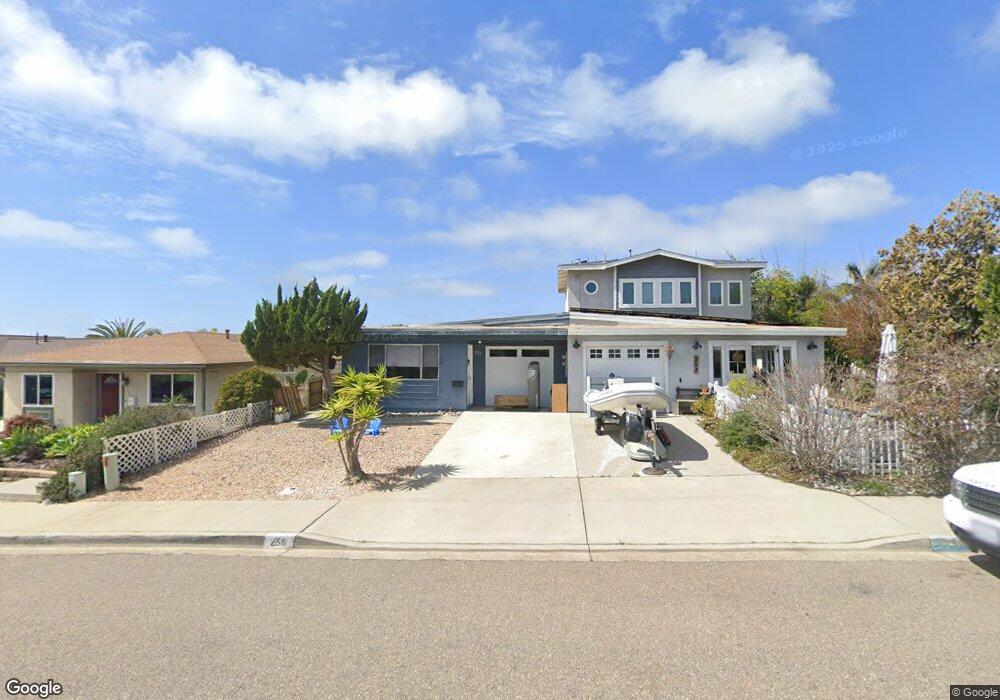
258 Delphinium St Encinitas, CA 92024
Central Encinitas NeighborhoodEstimated Value: $1,098,000 - $1,419,726
3
Beds
3
Baths
1,562
Sq Ft
$777/Sq Ft
Est. Value
About This Home
This home is located at 258 Delphinium St, Encinitas, CA 92024 and is currently estimated at $1,212,932, approximately $776 per square foot. 258 Delphinium St is a home located in San Diego County with nearby schools including Park Dale Lane Elementary, Oak Crest Middle School, and La Costa Canyon High School.
Ownership History
Date
Name
Owned For
Owner Type
Purchase Details
Closed on
Apr 19, 2017
Sold by
Tucker Jacob Field and Tucker Deana Darrah
Bought by
Tucker Jacob Field and Tucker Deana Darrah
Current Estimated Value
Home Financials for this Owner
Home Financials are based on the most recent Mortgage that was taken out on this home.
Original Mortgage
$592,470
Outstanding Balance
$493,024
Interest Rate
4.21%
Mortgage Type
VA
Estimated Equity
$719,908
Purchase Details
Closed on
Apr 16, 2004
Sold by
Tucker Jacob Field
Bought by
Tucker Jacob Field and Darrah Deana Sue
Purchase Details
Closed on
Oct 1, 2003
Sold by
Young Balch Robin
Bought by
Tucker Jacob Field
Home Financials for this Owner
Home Financials are based on the most recent Mortgage that was taken out on this home.
Original Mortgage
$324,800
Interest Rate
5.5%
Mortgage Type
Purchase Money Mortgage
Purchase Details
Closed on
Apr 13, 2000
Sold by
Hagerman Lorraine J Tr
Bought by
Hagerman Lorraine J
Create a Home Valuation Report for This Property
The Home Valuation Report is an in-depth analysis detailing your home's value as well as a comparison with similar homes in the area
Home Values in the Area
Average Home Value in this Area
Purchase History
| Date | Buyer | Sale Price | Title Company |
|---|---|---|---|
| Tucker Jacob Field | -- | Fidelity National Title Co | |
| Tucker Jacob Field | -- | -- | |
| Tucker Jacob Field | $406,000 | California Title Company | |
| Hagerman Lorraine J | -- | -- |
Source: Public Records
Mortgage History
| Date | Status | Borrower | Loan Amount |
|---|---|---|---|
| Open | Tucker Jacob Field | $592,470 | |
| Closed | Tucker Jacob Field | $324,800 | |
| Closed | Tucker Jacob Field | $81,200 |
Source: Public Records
Tax History
| Year | Tax Paid | Tax Assessment Tax Assessment Total Assessment is a certain percentage of the fair market value that is determined by local assessors to be the total taxable value of land and additions on the property. | Land | Improvement |
|---|---|---|---|---|
| 2025 | $7,849 | $705,514 | $426,531 | $278,983 |
| 2024 | $7,849 | $691,681 | $418,168 | $273,513 |
| 2023 | $7,603 | $678,119 | $409,969 | $268,150 |
| 2022 | $7,430 | $664,824 | $401,931 | $262,893 |
| 2021 | $7,314 | $651,789 | $394,050 | $257,739 |
| 2020 | $7,266 | $645,107 | $390,010 | $255,097 |
| 2019 | $7,123 | $632,459 | $382,363 | $250,096 |
| 2018 | $6,400 | $557,321 | $374,868 | $182,453 |
| 2017 | $191 | $497,374 | $367,518 | $129,856 |
| 2016 | $5,604 | $487,622 | $360,312 | $127,310 |
| 2015 | $5,529 | $480,298 | $354,900 | $125,398 |
| 2014 | $4,885 | $420,000 | $310,000 | $110,000 |
Source: Public Records
Map
Nearby Homes
- 271 Coneflower St
- 155 Rosebay Dr Unit 42
- 634 Shasta Dr
- 731 Teaberry St Unit 4
- 598 Paloma Ct
- 800 Encinitas Blvd Unit 104
- 548 Quail Pointe Ln
- 623 Quail Gardens Ln
- 935 Encinitas Blvd
- 664 Sea Ridge Ct
- 103 Mangano Cir
- 444 N El Camino Real Unit 47
- 444 N El Camino Real Unit 48
- 444 N El Camino Real Unit SPC 42
- 444 N El Camino Real Unit 119
- 444 N El Camino Real Unit 23
- 444 N El Camino Real Unit 110
- 537 Sweet Pea Place
- 836 Jensen Ct
- 350 N El Camino Real Unit 78s
- 256 Delphinium St
- 250 Delphinium St
- 252 Delphinium St
- 262 Delphinium St
- 264 Delphinium St
- 257 Coneflower St
- 259 Coneflower St
- 251 Coneflower St
- 253 Coneflower St
- 263 Coneflower St
- 265 Coneflower St
- 257 Delphinium St
- 259 Delphinium St
- 244 Delphinium St
- 246 Delphinium St
- 268 Delphinium St
- 270 Delphinium St
- 251 Delphinium St
- 253 Delphinium St
- 263 Delphinium St
Your Personal Tour Guide
Ask me questions while you tour the home.