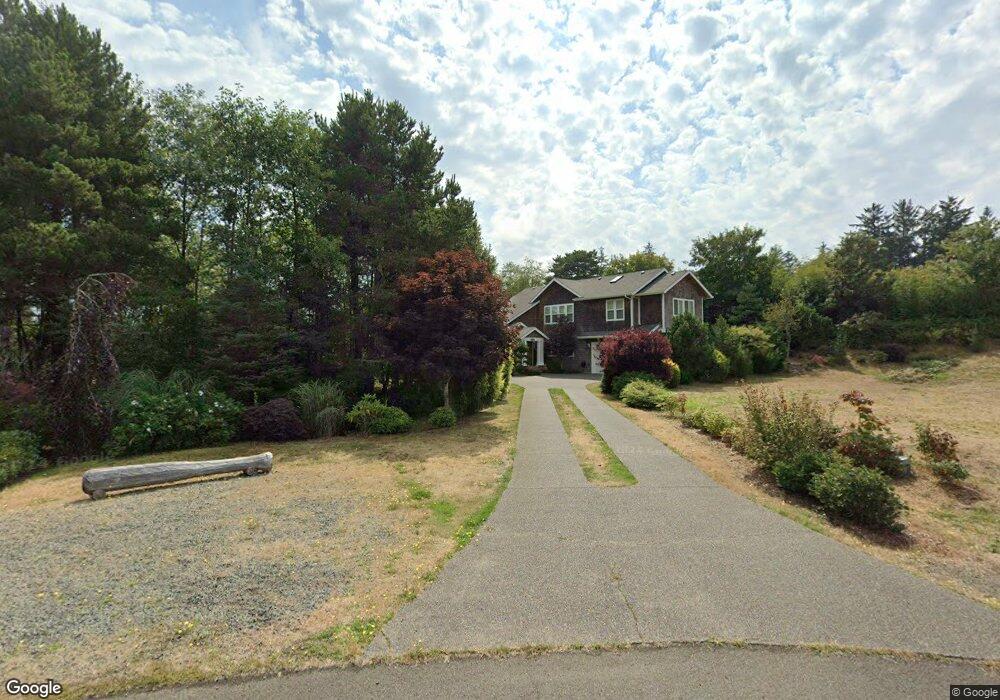
258 E Kershul Cir Seaside, OR 97138
Estimated Value: $768,000 - $828,000
3
Beds
4
Baths
1,449
Sq Ft
$547/Sq Ft
Est. Value
About This Home
This home is located at 258 E Kershul Cir, Seaside, OR 97138 and is currently estimated at $791,984, approximately $546 per square foot. 258 E Kershul Cir is a home located in Clatsop County with nearby schools including Seaside High School.
Ownership History
Date
Name
Owned For
Owner Type
Purchase Details
Closed on
Apr 13, 2011
Sold by
Newman Richard L and Newman Cheryl A
Bought by
Newman Richard L and Newman Cheryl A
Current Estimated Value
Purchase Details
Closed on
Apr 22, 2009
Sold by
Martin Jerry W
Bought by
Newman Richard L and Newman Cheryl A
Home Financials for this Owner
Home Financials are based on the most recent Mortgage that was taken out on this home.
Original Mortgage
$200,000
Interest Rate
4.99%
Mortgage Type
Unknown
Create a Home Valuation Report for This Property
The Home Valuation Report is an in-depth analysis detailing your home's value as well as a comparison with similar homes in the area
Purchase History
| Date | Buyer | Sale Price | Title Company |
|---|---|---|---|
| Newman Richard L | -- | None Available | |
| Newman Richard L | $385,000 | Ticor Title Ins Co |
Source: Public Records
Mortgage History
| Date | Status | Borrower | Loan Amount |
|---|---|---|---|
| Closed | Newman Richard L | $200,000 |
Source: Public Records
Tax History
| Year | Tax Paid | Tax Assessment Tax Assessment Total Assessment is a certain percentage of the fair market value that is determined by local assessors to be the total taxable value of land and additions on the property. | Land | Improvement |
|---|---|---|---|---|
| 2025 | $4,652 | $425,911 | -- | -- |
| 2024 | $4,729 | $413,507 | -- | -- |
| 2023 | $4,597 | $401,465 | $0 | $0 |
| 2022 | $4,459 | $389,773 | $0 | $0 |
| 2021 | $4,552 | $378,421 | $0 | $0 |
| 2020 | $4,391 | $367,400 | $0 | $0 |
| 2019 | $4,278 | $356,700 | $0 | $0 |
Source: Public Records
Map
Nearby Homes
- 646 Necanicum Dr
- 423 N Downing St
- 321 N Holladay Dr
- 135 6th Ave
- 908-910 N Franklin St
- 830 Oceanway St
- 815 N King St
- 911 1st Ave
- 1000 N Holladay Dr
- 1000 N Holladay Dr Unit 304
- 460 12th Ave
- 1110 6th Ave
- 416 S Downing St
- 1299 6th Ave
- 361 S Prom Unit 502
- 475 S Prom Unit 518
- 475 S Prom Unit 114
- 337 16th Ave
- 475 S Promenade
- 1255 Avenue A Unit 1 and 2
Your Personal Tour Guide
Ask me questions while you tour the home.