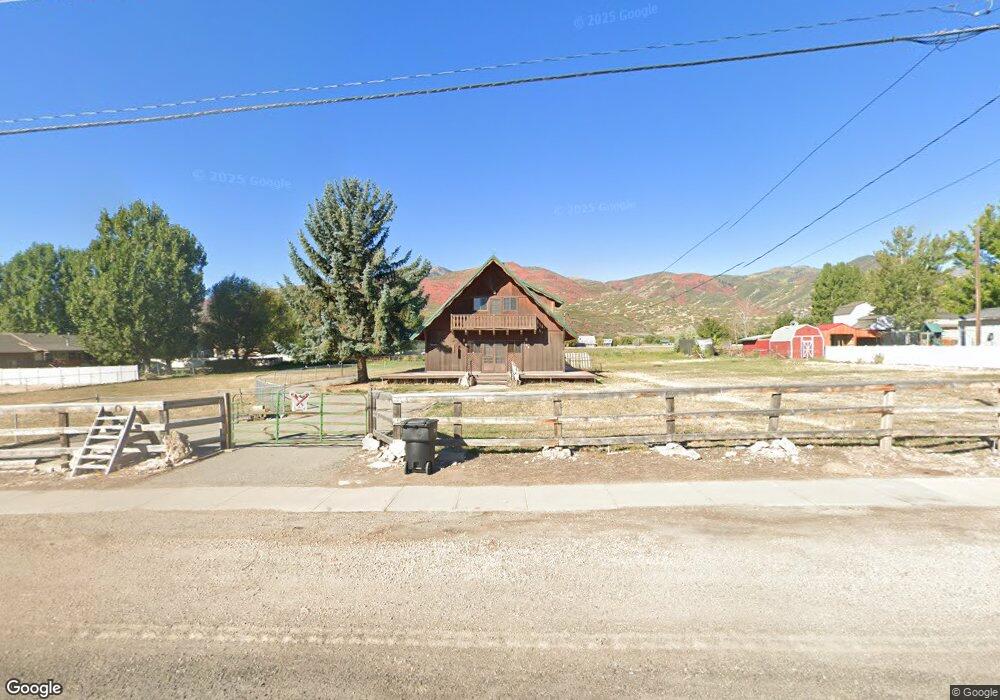
258 S Center St Midway, UT 84049
Estimated Value: $788,000 - $910,000
--
Bed
--
Bath
1,599
Sq Ft
$538/Sq Ft
Est. Value
About This Home
This home is located at 258 S Center St, Midway, UT 84049 and is currently estimated at $860,496, approximately $538 per square foot. 258 S Center St is a home with nearby schools including Midway Elementary School, Rocky Mountain Middle School, and Wasatch High School.
Ownership History
Date
Name
Owned For
Owner Type
Purchase Details
Closed on
Jul 19, 2024
Sold by
Linford Janet V
Bought by
Janet V Linford Family Living Revocable Trust and Linford
Current Estimated Value
Purchase Details
Closed on
May 11, 2015
Sold by
Hatch Michelle Linford and Van Linford Joseph
Bought by
Linford Joseph Richard and Linford Janet V
Purchase Details
Closed on
Mar 18, 2013
Sold by
Linford Joseph Richard and Linford Janet V
Bought by
Hatch Michelle Linford and Linford Joseph Van
Create a Home Valuation Report for This Property
The Home Valuation Report is an in-depth analysis detailing your home's value as well as a comparison with similar homes in the area
Home Values in the Area
Average Home Value in this Area
Purchase History
| Date | Buyer | Sale Price | Title Company |
|---|---|---|---|
| Janet V Linford Family Living Revocable Trust | -- | None Listed On Document | |
| Linford Janet V | -- | None Listed On Document | |
| Linford Joseph Richard | -- | None Available | |
| Hatch Michelle Linford | -- | None Available |
Source: Public Records
Tax History Compared to Growth
Tax History
| Year | Tax Paid | Tax Assessment Tax Assessment Total Assessment is a certain percentage of the fair market value that is determined by local assessors to be the total taxable value of land and additions on the property. | Land | Improvement |
|---|---|---|---|---|
| 2025 | $4,100 | $444,930 | $300,000 | $144,930 |
| 2024 | $4,054 | $444,930 | $300,000 | $144,930 |
| 2023 | $4,054 | $416,000 | $200,000 | $216,000 |
| 2022 | $4,171 | $416,000 | $200,000 | $216,000 |
| 2021 | $3,782 | $291,447 | $200,000 | $91,447 |
| 2020 | $3,211 | $239,947 | $148,500 | $91,447 |
| 2019 | $2,937 | $239,947 | $0 | $0 |
| 2018 | $2,937 | $239,947 | $0 | $0 |
| 2017 | $2,816 | $228,717 | $0 | $0 |
| 2016 | $2,887 | $228,717 | $0 | $0 |
| 2015 | $2,743 | $228,717 | $148,500 | $80,217 |
| 2014 | $2,855 | $228,717 | $148,500 | $80,217 |
Source: Public Records
Map
Nearby Homes
- 228 S Center St
- 241 S Center St
- 240 S Center St
- 249 S Center St
- 206 S Center St
- 296 S Center St
- 42 W 300 S
- 298 S Center St
- 205 S Center St Unit 10
- 205 S Center St
- 62 W 300 S
- 297 S Center St
- 190 S Center St
- 82 W 300 S
- 195 S Center St
- 82 W Michie Ln
- 54 E 200 S
- 35 W Michie Ln
- 50 E 200 S
- 50 E 200 S Unit 13