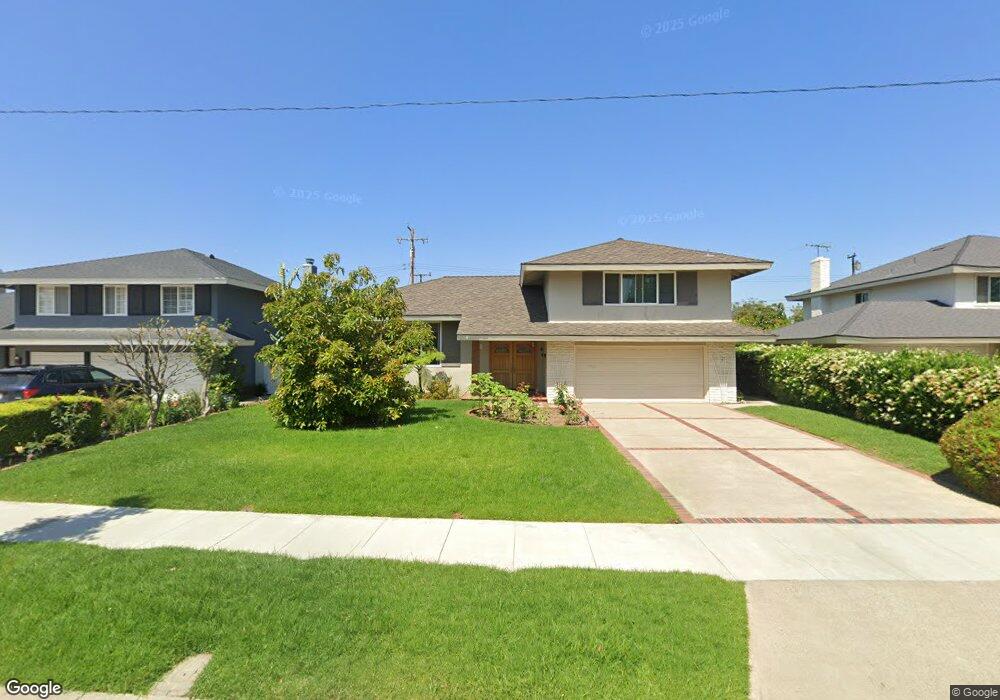
258 S Violet Ln Orange, CA 92869
Estimated Value: $1,301,000 - $1,649,000
3
Beds
3
Baths
2,364
Sq Ft
$605/Sq Ft
Est. Value
About This Home
This home is located at 258 S Violet Ln, Orange, CA 92869 and is currently estimated at $1,431,336, approximately $605 per square foot. 258 S Violet Ln is a home located in Orange County with nearby schools including La Veta Elementary School, El Modena High School, and Orange County Classical Academy.
Ownership History
Date
Name
Owned For
Owner Type
Purchase Details
Closed on
May 2, 2024
Sold by
Salter Cory G and Salter Kathleen
Bought by
Salter Family Trust and Salter
Current Estimated Value
Purchase Details
Closed on
Oct 24, 2001
Sold by
Salter Cory Glenn
Bought by
Salter Cory G and Salter Kathleen
Home Financials for this Owner
Home Financials are based on the most recent Mortgage that was taken out on this home.
Original Mortgage
$137,200
Interest Rate
6.87%
Purchase Details
Closed on
Jul 21, 1999
Sold by
Cory Salter
Bought by
Salter Cory Glenn
Purchase Details
Closed on
Apr 2, 1997
Sold by
Salter Denise
Bought by
Salter Cory
Purchase Details
Closed on
Oct 13, 1995
Sold by
Upson Edward M and Upson Barbara
Bought by
Salter Cory G and Salter Denise G
Home Financials for this Owner
Home Financials are based on the most recent Mortgage that was taken out on this home.
Original Mortgage
$139,500
Interest Rate
7.47%
Create a Home Valuation Report for This Property
The Home Valuation Report is an in-depth analysis detailing your home's value as well as a comparison with similar homes in the area
Home Values in the Area
Average Home Value in this Area
Purchase History
| Date | Buyer | Sale Price | Title Company |
|---|---|---|---|
| Salter Family Trust | -- | None Listed On Document | |
| Salter Cory G | -- | Fidelity National Title Co | |
| Salter Cory Glenn | -- | -- | |
| Salter Cory | -- | -- | |
| Salter Cory G | $241,500 | Orange Coast Title |
Source: Public Records
Mortgage History
| Date | Status | Borrower | Loan Amount |
|---|---|---|---|
| Previous Owner | Salter Cory G | $137,200 | |
| Previous Owner | Salter Cory G | $139,500 |
Source: Public Records
Tax History
| Year | Tax Paid | Tax Assessment Tax Assessment Total Assessment is a certain percentage of the fair market value that is determined by local assessors to be the total taxable value of land and additions on the property. | Land | Improvement |
|---|---|---|---|---|
| 2025 | $4,949 | $446,790 | $209,440 | $237,350 |
| 2024 | $4,949 | $438,030 | $205,333 | $232,697 |
| 2023 | $4,837 | $429,442 | $201,307 | $228,135 |
| 2022 | $4,741 | $421,022 | $197,360 | $223,662 |
| 2021 | $4,609 | $412,767 | $193,490 | $219,277 |
| 2020 | $4,566 | $408,535 | $191,506 | $217,029 |
| 2019 | $4,509 | $400,525 | $187,751 | $212,774 |
| 2018 | $4,439 | $392,672 | $184,070 | $208,602 |
| 2017 | $4,257 | $384,973 | $180,461 | $204,512 |
| 2016 | $4,174 | $377,425 | $176,923 | $200,502 |
| 2015 | $4,112 | $371,756 | $174,265 | $197,491 |
| 2014 | $4,023 | $364,474 | $170,851 | $193,623 |
Source: Public Records
Map
Nearby Homes
- 244 S Violet Ln
- 3139 E Chapman Ave Unit 3B
- 338 S James St
- 3030 E Elgin Place
- 3406 E Lochleven Ln Unit B
- 448 N Londonderry Ln Unit D
- 547 S Yorba St
- 369 S Jennifer Ln
- 629 S Yorba St
- 3801 E Spring St
- 2720 E Walnut Ave Unit 73
- 279 N Sacramento St
- 4223 E Marmon Ave
- 17922 Romelle Ave
- 478 N Swidler St
- 3527 E Barrington Dr
- 2705 E Orange Grove Ave
- 605 N Pageant Dr Unit B
- 4008 E Fernwood Ave
- 840 S Yorba St
- 268 S Violet Ln
- 259 S Kathleen Ln
- 234 S Violet Ln
- 278 S Violet Ln
- 271 S Kathleen Ln
- 249 S Kathleen Ln
- 283 S Kathleen Ln
- 237 S Kathleen Ln
- 263 S Violet Ln
- 251 S Violet Ln
- 222 S Violet Ln
- 288 S Violet Ln
- 277 S Violet Ln
- 241 S Violet Ln
- 3131 E Palmyra Ave
- 295 S Kathleen Ln
- 225 S Kathleen Ln
- 229 S Violet Ln
- 0 Palmyra Unit OC14183747
- 210 S Violet Ln
Your Personal Tour Guide
Ask me questions while you tour the home.