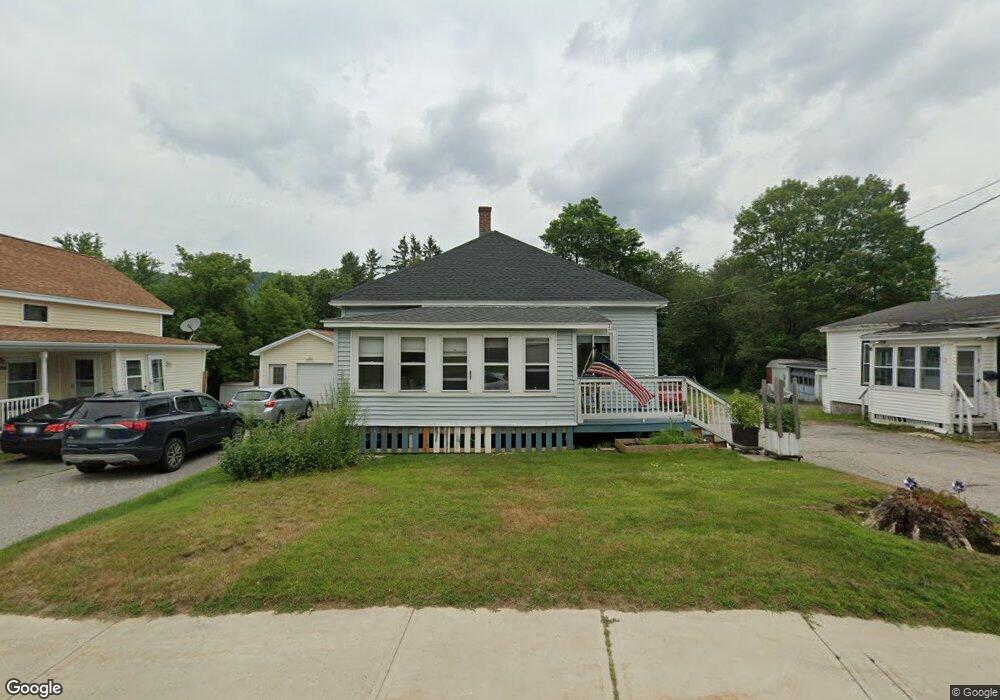
258 Wight St Berlin, NH 03570
Estimated Value: $147,000 - $183,000
2
Beds
1
Bath
1,022
Sq Ft
$161/Sq Ft
Est. Value
About This Home
This home is located at 258 Wight St, Berlin, NH 03570 and is currently estimated at $164,499, approximately $160 per square foot. 258 Wight St is a home located in Coos County with nearby schools including Berlin Elementary School, Berlin Middle School, and Berlin Senior High School.
Ownership History
Date
Name
Owned For
Owner Type
Purchase Details
Closed on
Apr 28, 2022
Sold by
Milkovits Charles S
Bought by
Remillard Gary R
Current Estimated Value
Home Financials for this Owner
Home Financials are based on the most recent Mortgage that was taken out on this home.
Original Mortgage
$100,560
Outstanding Balance
$93,716
Interest Rate
4.16%
Mortgage Type
Purchase Money Mortgage
Estimated Equity
$70,783
Purchase Details
Closed on
Apr 29, 2008
Sold by
Pelletier John R and Pelletier Priscilla R
Bought by
Milkovits Charles S
Home Financials for this Owner
Home Financials are based on the most recent Mortgage that was taken out on this home.
Original Mortgage
$54,051
Interest Rate
6.22%
Mortgage Type
Purchase Money Mortgage
Purchase Details
Closed on
Nov 1, 2005
Sold by
Fhlmc
Bought by
Pelletier John R and Pelletier Priscilla R
Purchase Details
Closed on
Aug 17, 2005
Sold by
Kolinsky Barbara J
Bought by
Fhlmc
Create a Home Valuation Report for This Property
The Home Valuation Report is an in-depth analysis detailing your home's value as well as a comparison with similar homes in the area
Purchase History
| Date | Buyer | Sale Price | Title Company |
|---|---|---|---|
| Remillard Gary R | $98,266 | None Available | |
| Remillard Gary R | $98,266 | None Available | |
| Milkovits Charles S | $55,000 | -- | |
| Pelletier John R | $68,000 | -- | |
| Fhlmc | $24,800 | -- |
Source: Public Records
Mortgage History
| Date | Status | Borrower | Loan Amount |
|---|---|---|---|
| Open | Remillard Gary R | $100,560 | |
| Closed | Remillard Gary R | $100,560 | |
| Previous Owner | Fhlmc | $33,750 | |
| Previous Owner | Fhlmc | $54,051 |
Source: Public Records
Tax History
| Year | Tax Paid | Tax Assessment Tax Assessment Total Assessment is a certain percentage of the fair market value that is determined by local assessors to be the total taxable value of land and additions on the property. | Land | Improvement |
|---|---|---|---|---|
| 2025 | $3,649 | $108,600 | $15,700 | $92,900 |
| 2024 | $3,355 | $108,600 | $15,700 | $92,900 |
| 2023 | $2,921 | $108,600 | $15,700 | $92,900 |
| 2022 | $2,960 | $108,600 | $15,700 | $92,900 |
| 2021 | $2,386 | $65,300 | $11,300 | $54,000 |
| 2020 | $2,346 | $65,300 | $11,300 | $54,000 |
| 2018 | $1,786 | $56,100 | $7,400 | $48,700 |
| 2017 | $1,787 | $45,600 | $4,200 | $41,400 |
| 2016 | $1,826 | $46,600 | $4,200 | $42,400 |
| 2014 | $2,154 | $64,600 | $12,800 | $51,800 |
| 2013 | $2,132 | $64,600 | $12,800 | $51,800 |
Source: Public Records
Map
Nearby Homes
- 0 Wight St
- 0 Jericho Rd Unit 13.01
- 0 Portage Place Unit 13
- 437 Willard St
- 800 Fifth Ave
- 820 Fourth Ave
- 199 Collins St
- 798 5th Ave
- 185 Park St
- 804 Third Ave
- 448 Church St
- 266 Madison Ave
- 6 Demers St
- 724 Third Ave
- 00 Church St Unit 60
- 213 Hillside Ave
- 661 4th Ave
- 617 4th Ave
- 216 Prospect St
- 116 Washington St
Your Personal Tour Guide
Ask me questions while you tour the home.