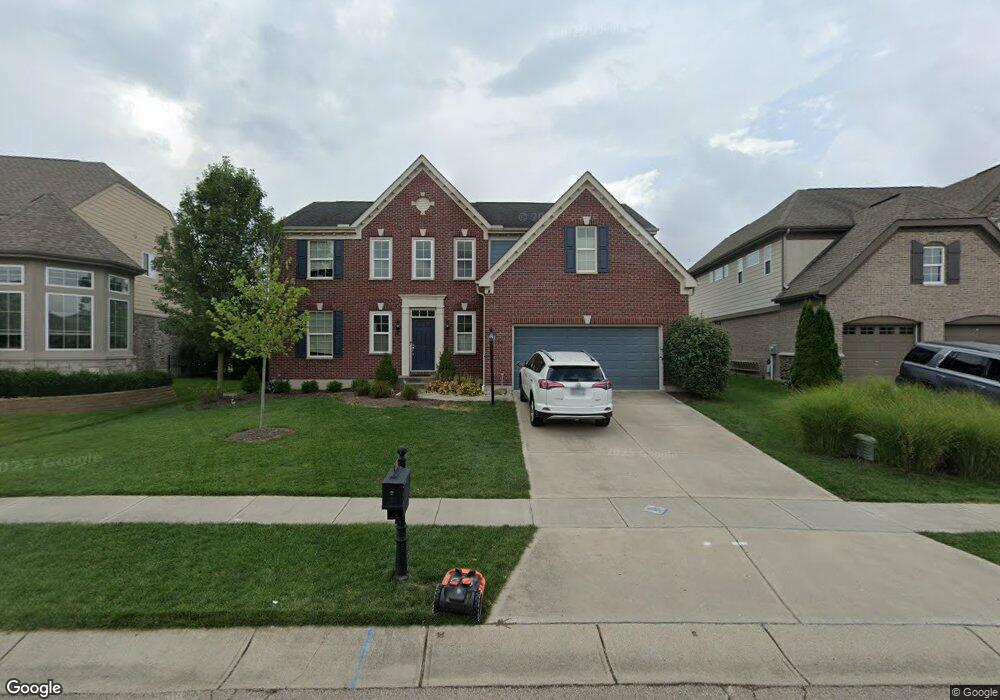
258 Woodstream Dr Springboro, OH 45066
Clearcreek Township NeighborhoodEstimated Value: $567,025 - $654,000
5
Beds
4
Baths
2,893
Sq Ft
$209/Sq Ft
Est. Value
About This Home
This home is located at 258 Woodstream Dr, Springboro, OH 45066 and is currently estimated at $604,006, approximately $208 per square foot. 258 Woodstream Dr is a home with nearby schools including Clearcreek Elementary School, Springboro Intermediate School, and Springboro Junior High School.
Ownership History
Date
Name
Owned For
Owner Type
Purchase Details
Closed on
Dec 19, 2012
Sold by
Fischer Single Family Homes Ii Llc
Bought by
Meyer Christopher I
Current Estimated Value
Home Financials for this Owner
Home Financials are based on the most recent Mortgage that was taken out on this home.
Original Mortgage
$244,854
Outstanding Balance
$168,923
Interest Rate
3.28%
Mortgage Type
New Conventional
Estimated Equity
$435,083
Purchase Details
Closed on
Sep 30, 2010
Sold by
Sw Holdings Land Llc
Bought by
Fischer Development Co Ii Inc
Purchase Details
Closed on
Sep 29, 2010
Sold by
The Home Savings & Loan Company Of Young
Bought by
Sw Holdings Land Llc
Purchase Details
Closed on
Jan 11, 2010
Sold by
Coffman Springs Llc
Bought by
The Home Savings & Loan Company Of Young
Create a Home Valuation Report for This Property
The Home Valuation Report is an in-depth analysis detailing your home's value as well as a comparison with similar homes in the area
Home Values in the Area
Average Home Value in this Area
Purchase History
| Date | Buyer | Sale Price | Title Company |
|---|---|---|---|
| Meyer Christopher I | $274,700 | Homestead Title | |
| Fischer Development Co Ii Inc | $1,307,833 | Lawyers Title Cincinnati | |
| Sw Holdings Land Llc | $1,380,033 | Lawyers Title Cincinnati | |
| The Home Savings & Loan Company Of Young | $2,800,000 | None Available |
Source: Public Records
Mortgage History
| Date | Status | Borrower | Loan Amount |
|---|---|---|---|
| Open | Meyer Christopher I | $244,854 |
Source: Public Records
Tax History Compared to Growth
Tax History
| Year | Tax Paid | Tax Assessment Tax Assessment Total Assessment is a certain percentage of the fair market value that is determined by local assessors to be the total taxable value of land and additions on the property. | Land | Improvement |
|---|---|---|---|---|
| 2024 | $6,946 | $177,860 | $35,000 | $142,860 |
| 2023 | $5,867 | $137,784 | $16,520 | $121,264 |
| 2022 | $5,781 | $137,785 | $16,520 | $121,265 |
| 2021 | $5,380 | $137,785 | $16,520 | $121,265 |
| 2020 | $5,215 | $116,767 | $14,000 | $102,767 |
| 2019 | $4,809 | $116,767 | $14,000 | $102,767 |
| 2018 | $4,812 | $116,767 | $14,000 | $102,767 |
| 2017 | $4,189 | $91,571 | $13,461 | $78,110 |
| 2016 | $4,492 | $91,571 | $13,461 | $78,110 |
| 2015 | $4,131 | $91,571 | $13,461 | $78,110 |
| 2014 | $4,131 | $79,630 | $11,700 | $67,920 |
| 2013 | $4,131 | $95,240 | $14,000 | $81,240 |
Source: Public Records
Map
Nearby Homes
- 65 Artesian Ct
- 155 Clearsprings Dr
- 270 Sycamore Springs Dr
- 111 Rippling Brook Ln
- 165 Waterhaven Way
- 285 Waterhaven Way
- 146 Rippling Brook Ln
- 5 Old Pond Rd
- 44 Old Pond Rd
- 163 Oasis Ct
- 160 Old Pond Rd
- 1015 W Lytle 5 Points Rd
- 108 Old Pond Rd
- 195 Oasis Ct
- 85 Glass Ct
- 10109 Gully Pass Dr
- 10090 Gully Pass Dr
- 10084 Gully Pass Dr
- 85 Meadows Dr
- 1201 Woodland Greens Blvd
- 250 Woodstream Dr Unit 79
- 250 Woodstream Dr
- 266 Woodstream Dr Unit 77
- 266 Woodstream Dr
- 165 Wellspring Dr
- 240 Woodstream Dr
- 274 Woodstream Dr
- 145 Wellspring Dr
- 255 Woodstream Dr
- 265 Woodstream Dr
- 230 Woodstream Dr
- 245 Woodstream Dr
- 185 Wellspring Dr
- 275 Woodstream Dr
- 125 Wellspring Dr
- 235 Woodstream Dr Unit 85
- 235 Woodstream Dr
- 282 Woodstream Dr
- 290 Woodstream Dr
- 285 Woodstream Dr Unit 90