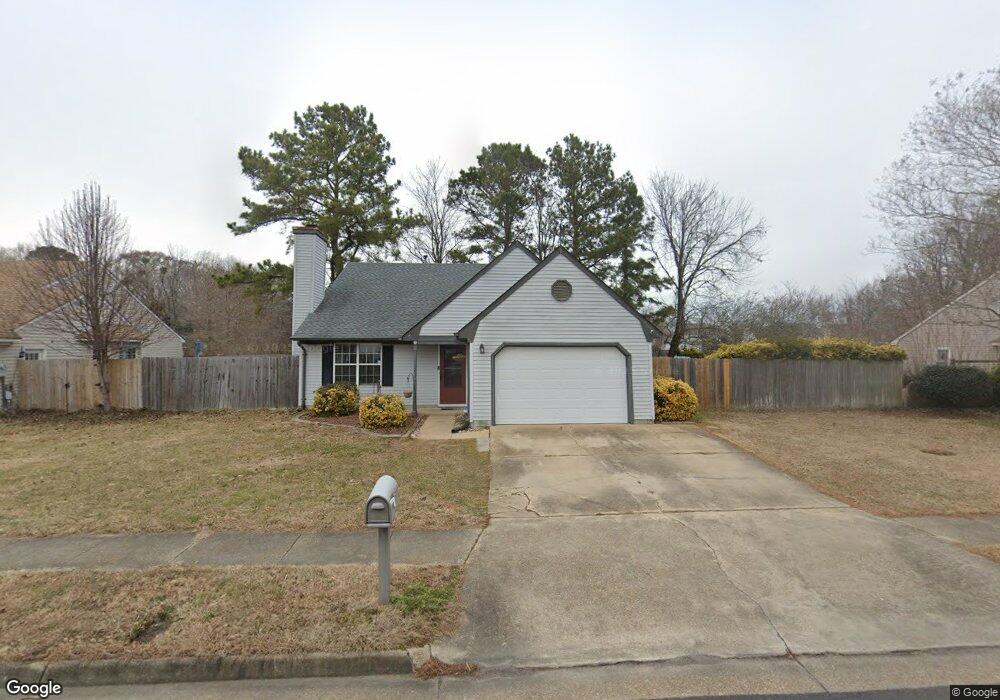
2580 Hunters Run Trail Virginia Beach, VA 23456
Dam Neck NeighborhoodEstimated Value: $385,000 - $444,441
3
Beds
2
Baths
1,303
Sq Ft
$320/Sq Ft
Est. Value
About This Home
This home is located at 2580 Hunters Run Trail, Virginia Beach, VA 23456 and is currently estimated at $416,860, approximately $319 per square foot. 2580 Hunters Run Trail is a home located in Virginia Beach City with nearby schools including Strawbridge Elementary School, Princess Anne Middle School, and Floyd E. Kellam High School.
Ownership History
Date
Name
Owned For
Owner Type
Purchase Details
Closed on
Sep 28, 2023
Sold by
Corbett Brian J
Bought by
Psarros James P
Current Estimated Value
Home Financials for this Owner
Home Financials are based on the most recent Mortgage that was taken out on this home.
Original Mortgage
$340,000
Outstanding Balance
$332,963
Interest Rate
7.09%
Mortgage Type
VA
Estimated Equity
$83,897
Purchase Details
Closed on
Jun 17, 2017
Sold by
Rayner Sean C
Bought by
Corbett Brian J
Home Financials for this Owner
Home Financials are based on the most recent Mortgage that was taken out on this home.
Original Mortgage
$232,425
Interest Rate
4.05%
Mortgage Type
FHA
Purchase Details
Closed on
Apr 22, 2002
Sold by
King Dawn L
Bought by
Rayner Sean C
Home Financials for this Owner
Home Financials are based on the most recent Mortgage that was taken out on this home.
Original Mortgage
$126,514
Interest Rate
7.13%
Mortgage Type
FHA
Create a Home Valuation Report for This Property
The Home Valuation Report is an in-depth analysis detailing your home's value as well as a comparison with similar homes in the area
Home Values in the Area
Average Home Value in this Area
Purchase History
| Date | Buyer | Sale Price | Title Company |
|---|---|---|---|
| Psarros James P | $340,000 | Fidelity National Title | |
| Corbett Brian J | $225,000 | Advance Title & Abstract | |
| Rayner Sean C | $128,500 | -- |
Source: Public Records
Mortgage History
| Date | Status | Borrower | Loan Amount |
|---|---|---|---|
| Open | Psarros James P | $340,000 | |
| Previous Owner | Corbett Brian J | $232,425 | |
| Previous Owner | Rayner Sean C | $126,514 |
Source: Public Records
Tax History Compared to Growth
Tax History
| Year | Tax Paid | Tax Assessment Tax Assessment Total Assessment is a certain percentage of the fair market value that is determined by local assessors to be the total taxable value of land and additions on the property. | Land | Improvement |
|---|---|---|---|---|
| 2025 | $3,387 | $368,200 | $180,000 | $188,200 |
| 2024 | $3,387 | $349,200 | $180,000 | $169,200 |
| 2023 | $3,156 | $318,800 | $120,000 | $198,800 |
| 2022 | $2,421 | $244,500 | $97,000 | $147,500 |
| 2021 | $2,359 | $238,300 | $97,000 | $141,300 |
| 2020 | $2,277 | $223,800 | $97,000 | $126,800 |
| 2019 | $2,389 | $228,900 | $97,000 | $131,900 |
| 2018 | $2,295 | $228,900 | $97,000 | $131,900 |
| 2017 | $2,255 | $224,900 | $97,000 | $127,900 |
| 2016 | $2,065 | $208,600 | $95,000 | $113,600 |
| 2015 | $2,228 | $225,000 | $105,000 | $120,000 |
| 2014 | $1,955 | $213,000 | $105,000 | $108,000 |
Source: Public Records
Map
Nearby Homes
- 2305 Wheatstone Ct
- 2436 Pitchfork Way
- 2277 Huckleberry Trail
- 2309 Seaboard Rd
- 2296 Brownshire Trail
- 2424 Huckleberry Trail
- 2385 Huckleberry Trail
- 2417 Hay Bale Ln
- 2412 Hay Bale Ln
- 2321 Mathews Green Rd
- 1306 Tuscany Dr
- 2304 Apple Tree Crescent
- 2020 Bloomsbury Crescent
- 2160 Bloomsbury Ln
- 2641 Springhaven Dr
- 2033 Ealing Crescent
- 2569 Springhaven Dr
- 1808 Kensal Green Dr
- 2208 Brushwood Terrace
- 2537 Springhaven Dr
- 2584 Hunters Run Trail
- 2576 Hunters Run Trail
- 2588 Hunters Run Trail
- 2572 Hunters Run Trail
- 2008 Dry Creek Ct
- 2581 Hunters Run Trail
- 2573 Hunters Run Trail
- 2592 Hunters Run Trail
- 2004 Dry Creek Ct
- 2589 Hunters Run Trail
- 2568 Hunters Run Trail
- 2569 Hunters Run Trail
- 2593 Hunters Run Trail
- 2012 Dry Creek Ct
- 2564 Hunters Run Trail
- 2565 Hunters Run Trail
- 2597 Hunters Run Trail
- 2560 Hunters Run Trail
- 2600 Hunters Run Trail
- 2016 Dry Creek Ct