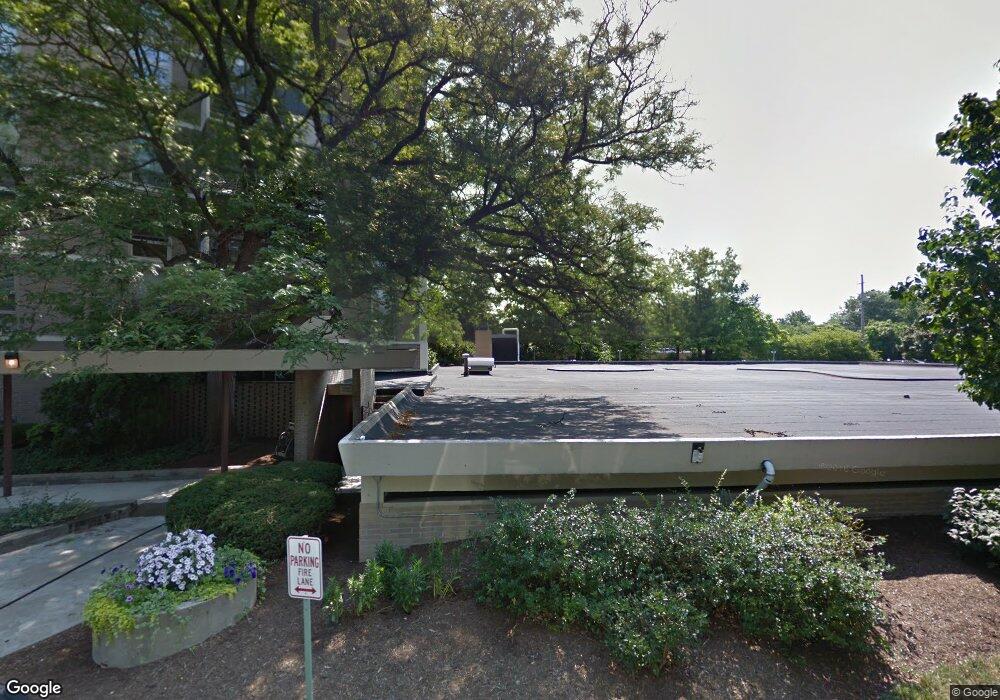
Bonneville Tower 25801 Lake Shore Blvd Unit 75 Euclid, OH 44132
Estimated Value: $67,000 - $86,000
1
Bed
1
Bath
740
Sq Ft
$99/Sq Ft
Est. Value
About This Home
This home is located at 25801 Lake Shore Blvd Unit 75, Euclid, OH 44132 and is currently estimated at $72,945, approximately $98 per square foot. 25801 Lake Shore Blvd Unit 75 is a home located in Cuyahoga County with nearby schools including Shoreview Elementary School, Euclid High School, and Ss. Robert & William Catholic School.
Ownership History
Date
Name
Owned For
Owner Type
Purchase Details
Closed on
Jan 22, 2004
Sold by
Shipley Norma J
Bought by
Sherman Julie E
Current Estimated Value
Purchase Details
Closed on
Dec 10, 2002
Sold by
Neff Russell F and Neff Ann
Bought by
Shipley Norma J
Purchase Details
Closed on
Nov 25, 2002
Sold by
Cottrell Doris J
Bought by
Neff Russell F
Purchase Details
Closed on
Jun 26, 1998
Sold by
Adamson Jack J
Bought by
Cottrell Doris J
Purchase Details
Closed on
Mar 29, 1996
Sold by
Hoddinott Nella M
Bought by
Adamson Jack J
Purchase Details
Closed on
Jul 30, 1991
Sold by
Vranekovic James D
Bought by
Pinzone Nella M
Purchase Details
Closed on
Jan 1, 1980
Bought by
Vranekovic James D
Create a Home Valuation Report for This Property
The Home Valuation Report is an in-depth analysis detailing your home's value as well as a comparison with similar homes in the area
Home Values in the Area
Average Home Value in this Area
Purchase History
| Date | Buyer | Sale Price | Title Company |
|---|---|---|---|
| Sherman Julie E | $51,000 | Real Living Title Agency Ltd | |
| Shipley Norma J | -- | Real Living Title Agency Ltd | |
| Neff Russell F | $50,000 | Real Living Title Agency Ltd | |
| Cottrell Doris J | $51,000 | Title Xperts Agency Inc | |
| Adamson Jack J | $6,000 | -- | |
| Pinzone Nella M | $40,000 | -- | |
| Vranekovic James D | -- | -- |
Source: Public Records
Tax History Compared to Growth
Tax History
| Year | Tax Paid | Tax Assessment Tax Assessment Total Assessment is a certain percentage of the fair market value that is determined by local assessors to be the total taxable value of land and additions on the property. | Land | Improvement |
|---|---|---|---|---|
| 2024 | $1,292 | $19,635 | $1,960 | $17,675 |
| 2023 | $924 | $11,200 | $1,120 | $10,080 |
| 2022 | $902 | $11,200 | $1,120 | $10,080 |
| 2021 | $1,010 | $11,200 | $1,120 | $10,080 |
| 2020 | $932 | $9,420 | $950 | $8,470 |
| 2019 | $842 | $26,900 | $2,700 | $24,200 |
| 2018 | $855 | $9,420 | $950 | $8,470 |
| 2017 | $1,259 | $11,630 | $1,160 | $10,470 |
| 2016 | $1,262 | $11,630 | $1,160 | $10,470 |
| 2015 | $1,160 | $11,630 | $1,160 | $10,470 |
| 2014 | $2,063 | $13,690 | $1,370 | $12,320 |
Source: Public Records
About Bonneville Tower
Map
Nearby Homes
- 25801 Lakeshore Blvd Unit 42
- 25801 Lake Shore Blvd Unit 23
- 25801 Lake Shore Blvd Unit 64
- 25801 Lake Shore Blvd Unit 130
- 25801 Lake Shore Blvd Unit 28
- 25380 Lakeshore Blvd
- 355 E 262nd St
- 110 E 252nd St
- 327 E 255th St
- 325 E 257th St
- 369 E 270th St
- 405 E 262nd St
- 251 E 250th St
- 253 E 250th St
- 415 E 266th St
- 26230 Oriole Ave
- 440 E 271st St
- 225 E 246th St
- 461 E 271st St
- 26171 Shoreview Ave
- 25801 Lake Shore Blvd Unit 38
- 25801 Lake Shore Blvd Unit 30
- 25801 Lake Shore Blvd Unit 29
- 25801 Lake Shore Blvd Unit 50
- 25801 Lake Shore Blvd Unit 93
- 25801 Lake Shore Blvd Unit 67
- 25801 Lake Shore Blvd Unit 113
- 25801 Lake Shore Blvd Unit 101
- 25801 Lake Shore Blvd Unit 95
- 25801 Lake Shore Blvd Unit 133
- 25801 Lake Shore Blvd Unit 77
- 25801 Lake Shore Blvd Unit 107
- 25801 Lake Shore Blvd Unit 114
- 25801 Lake Shore Blvd Unit 116
- 25801 Lake Shore Blvd Unit 124
- 25801 Lake Shore Blvd Unit 56
- 25801 Lake Shore Blvd Unit 89
- 25801 Lake Shore Blvd Unit 109
- 25801 Lake Shore Blvd Unit 71
- 25801 Lake Shore Blvd Unit 88