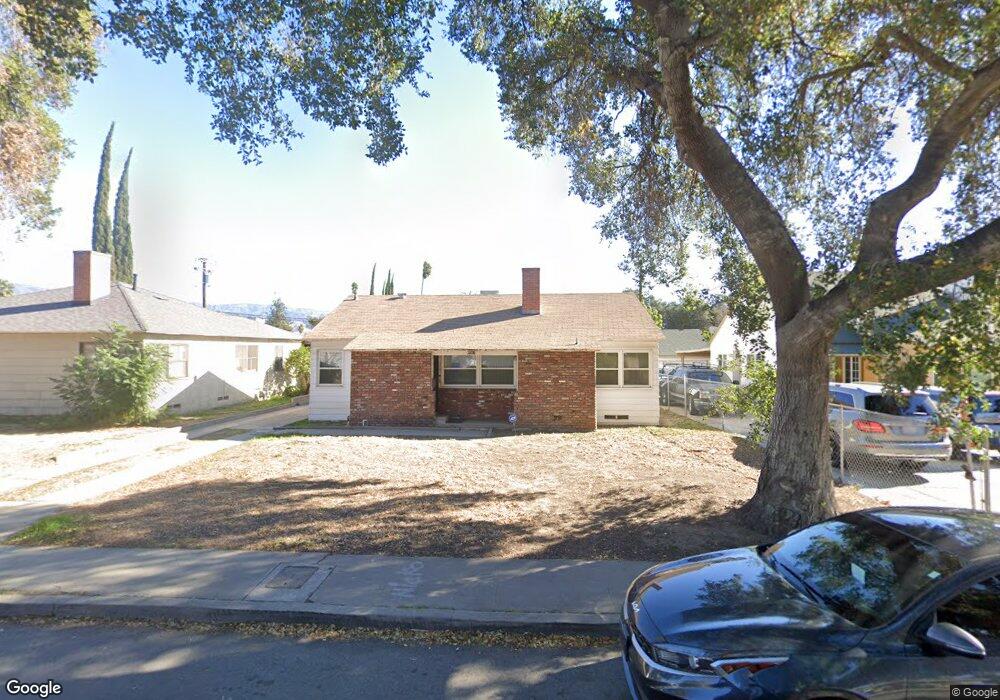
2581 Davidson Ave San Bernardino, CA 92405
Muscupiabe NeighborhoodEstimated Value: $425,000 - $492,000
3
Beds
2
Baths
--
Sq Ft
7,841
Sq Ft Lot
About This Home
This home is located at 2581 Davidson Ave, San Bernardino, CA 92405 and is currently estimated at $453,582. 2581 Davidson Ave is a home located in San Bernardino County with nearby schools including Davidson Elementary School, Shandin Hills Middle School, and San Bernardino High School.
Ownership History
Date
Name
Owned For
Owner Type
Purchase Details
Closed on
Apr 26, 1997
Sold by
Washington Princella
Bought by
Johnson Tyrone
Current Estimated Value
Home Financials for this Owner
Home Financials are based on the most recent Mortgage that was taken out on this home.
Original Mortgage
$84,956
Outstanding Balance
$11,052
Interest Rate
7.96%
Mortgage Type
FHA
Estimated Equity
$442,530
Purchase Details
Closed on
Mar 27, 1997
Sold by
Ruz Alex A and Ruz Mayelin
Bought by
Johnson Tyrone
Home Financials for this Owner
Home Financials are based on the most recent Mortgage that was taken out on this home.
Original Mortgage
$84,956
Outstanding Balance
$11,052
Interest Rate
7.96%
Mortgage Type
FHA
Estimated Equity
$442,530
Purchase Details
Closed on
Nov 25, 1996
Sold by
Hud
Bought by
Ruz Alex A and Ruz Mayelin
Home Financials for this Owner
Home Financials are based on the most recent Mortgage that was taken out on this home.
Original Mortgage
$49,431
Interest Rate
7.67%
Mortgage Type
FHA
Purchase Details
Closed on
Jul 8, 1996
Sold by
Mccraw Debra J and Anderson Patricia A
Bought by
Occidental Mtg Corp
Purchase Details
Closed on
Jul 1, 1996
Sold by
Occidental Mtg Corp
Bought by
Hud
Create a Home Valuation Report for This Property
The Home Valuation Report is an in-depth analysis detailing your home's value as well as a comparison with similar homes in the area
Home Values in the Area
Average Home Value in this Area
Purchase History
| Date | Buyer | Sale Price | Title Company |
|---|---|---|---|
| Johnson Tyrone | -- | First Southwestern Title Co | |
| Johnson Tyrone | $85,000 | First Southwestern Title Co | |
| Ruz Alex A | $50,000 | United Title | |
| Occidental Mtg Corp | $73,771 | Northern Counties Title Ins | |
| Hud | -- | Northern Counties Title Ins |
Source: Public Records
Mortgage History
| Date | Status | Borrower | Loan Amount |
|---|---|---|---|
| Open | Johnson Tyrone | $84,956 | |
| Previous Owner | Ruz Alex A | $49,431 |
Source: Public Records
Tax History Compared to Growth
Tax History
| Year | Tax Paid | Tax Assessment Tax Assessment Total Assessment is a certain percentage of the fair market value that is determined by local assessors to be the total taxable value of land and additions on the property. | Land | Improvement |
|---|---|---|---|---|
| 2025 | $4,415 | $138,442 | $40,718 | $97,724 |
| 2024 | $4,415 | $135,728 | $39,920 | $95,808 |
| 2023 | $4,368 | $133,066 | $39,137 | $93,929 |
| 2022 | $4,364 | $130,457 | $38,370 | $92,087 |
| 2021 | $4,352 | $127,899 | $37,618 | $90,281 |
| 2020 | $4,322 | $126,587 | $37,232 | $89,355 |
| 2019 | $4,260 | $124,105 | $36,502 | $87,603 |
| 2018 | $4,005 | $121,671 | $35,786 | $85,885 |
| 2017 | $3,815 | $119,285 | $35,084 | $84,201 |
| 2016 | $3,736 | $116,946 | $34,396 | $82,550 |
| 2015 | $1,527 | $115,189 | $33,879 | $81,310 |
| 2014 | $1,485 | $112,932 | $33,215 | $79,717 |
Source: Public Records
Map
Nearby Homes
- 1136 W 26th St
- 1286 W 23rd St
- 2777 Serrano Rd
- 1298 W 23rd St
- 2881 Davidson Ave
- 694 N Mount Vernon Ave
- 0 Arrowhead Unit CV25224316
- 2 Joshua Tree
- 915 W 23rd St
- 1950 N Mount Vernon Ave
- 871 W 29th St
- 0 Grande Vista Dr
- 1344 N H St
- 1708 N Mount Vernon Ave
- 725 W 26th St
- 3098 Herrington Ave
- 772 W 20th St
- 0 Sierra Vista Ln
- 2838 N G St
- 2747 N G St
- 2551 Davidson Ave
- 2589 Davidson Ave
- 2521 Davidson Ave
- 2591 Davidson Ave
- 2580 Serrano Rd
- 2588 Serrano Rd
- 2489 Davidson Ave
- 2601 Davidson Ave
- 2550 Serrano Rd
- 1207 W 26th St
- 1208 W 25th St
- 2598 Serrano Rd
- 2520 Serrano Rd
- 2520 Serrano Rd N
- 2457 Davidson Ave
- 2617 Davidson Ave
- 1215 W 26 St
- 1215 W 26th St
- 1216 W 25th St
- 2616 Serrano Rd