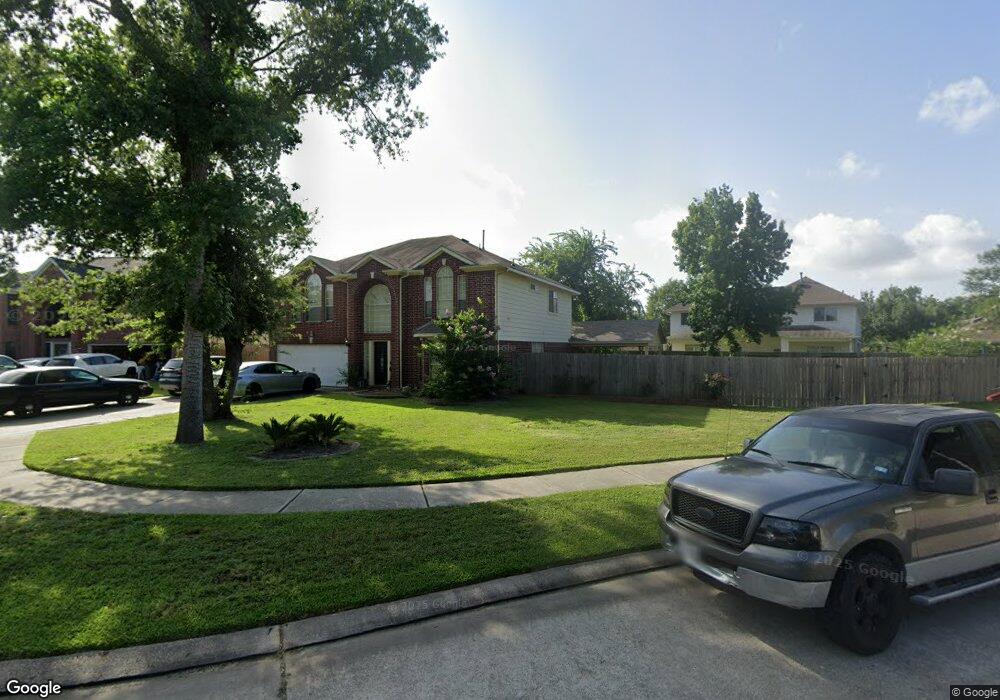
25822 Oakridge Forest Ct Spring, TX 77386
Estimated Value: $288,891 - $327,000
--
Bed
3
Baths
2,042
Sq Ft
$154/Sq Ft
Est. Value
About This Home
This home is located at 25822 Oakridge Forest Ct, Spring, TX 77386 and is currently estimated at $313,973, approximately $153 per square foot. 25822 Oakridge Forest Ct is a home located in Montgomery County with nearby schools including Oak Ridge Elementary School, Vogel Intermediate School, and Irons J High School.
Ownership History
Date
Name
Owned For
Owner Type
Purchase Details
Closed on
Jun 5, 2008
Sold by
Pinelo Jorge and Pinelo Araceli Figueroa
Bought by
Samora Frankie Lee and Samora Karla
Current Estimated Value
Home Financials for this Owner
Home Financials are based on the most recent Mortgage that was taken out on this home.
Original Mortgage
$147,000
Outstanding Balance
$94,426
Interest Rate
6.07%
Mortgage Type
VA
Estimated Equity
$219,547
Purchase Details
Closed on
Aug 11, 1999
Sold by
Deerwood Homes Inc
Bought by
Pinelo Jorge and Pinelo Araceli Figueroa
Home Financials for this Owner
Home Financials are based on the most recent Mortgage that was taken out on this home.
Original Mortgage
$90,000
Interest Rate
7.71%
Mortgage Type
Purchase Money Mortgage
Purchase Details
Closed on
May 7, 1999
Sold by
Oakridge Associates
Bought by
Samora Frankie Lee and Samora Karla
Create a Home Valuation Report for This Property
The Home Valuation Report is an in-depth analysis detailing your home's value as well as a comparison with similar homes in the area
Home Values in the Area
Average Home Value in this Area
Purchase History
| Date | Buyer | Sale Price | Title Company |
|---|---|---|---|
| Samora Frankie Lee | -- | Stewart Title Of Montgomery | |
| Pinelo Jorge | -- | American Title Company | |
| Samora Frankie Lee | -- | -- |
Source: Public Records
Mortgage History
| Date | Status | Borrower | Loan Amount |
|---|---|---|---|
| Open | Samora Frankie Lee | $147,000 | |
| Previous Owner | Pinelo Jorge | $90,000 |
Source: Public Records
Tax History Compared to Growth
Tax History
| Year | Tax Paid | Tax Assessment Tax Assessment Total Assessment is a certain percentage of the fair market value that is determined by local assessors to be the total taxable value of land and additions on the property. | Land | Improvement |
|---|---|---|---|---|
| 2025 | $3,605 | $286,373 | $58,000 | $228,373 |
| 2024 | $3,187 | $269,610 | -- | -- |
| 2023 | $3,187 | $245,100 | $58,000 | $231,710 |
| 2022 | $4,503 | $222,820 | $58,000 | $195,460 |
| 2021 | $4,352 | $202,560 | $11,000 | $191,560 |
| 2020 | $4,207 | $187,480 | $11,000 | $176,480 |
| 2019 | $4,099 | $188,500 | $11,000 | $177,910 |
| 2018 | $3,340 | $171,360 | $11,000 | $160,360 |
| 2017 | $3,972 | $169,210 | $11,000 | $160,360 |
| 2016 | $3,611 | $153,830 | $11,000 | $142,830 |
| 2015 | $3,129 | $152,910 | $11,000 | $149,770 |
| 2014 | $3,129 | $139,010 | $11,000 | $128,010 |
Source: Public Records
Map
Nearby Homes
- 25819 Oakridge Forest Ln
- 25807 Oakridge Forest Ln
- 519 Joshua Lee Ln
- 25619 Oakridge Forest Ln
- 323 Spring Woods Dr
- 26003 Woodglen Dr
- 427 Pinewood Ridge Dr
- 25802 Maplewood Dr
- 26107 Maplewood Dr
- 25535 Richards Rd
- 119 Heatherwood Dr
- 1010 Forestburg Dr
- 0 Sagewood
- 25206 #5 Spring Ridge Dr
- 25142 Andris Ln
- 25206 Spring Ridge Dr
- 25131 Alina Ln
- 186 Spring Pines Dr
- 31003 N Head Dr
- 25657 Interstate 45
- 607 Gamewood Dr
- 611 Gamewood Dr
- 25826 Oakridge Forest Ct
- 603 Gamewood Dr
- 615 Gamewood Dr
- 25830 Oakridge Forest Ct
- 25815 Oakridge Forest Ln
- 25834 Oakridge Forest Ct
- 522 Joshua Lee Ln
- 518 Joshua Lee Ln
- 25811 Oakridge Forest Ln
- 25838 Oakridge Forest Ln
- 25722 Gamewood Ct
- 514 Joshua Lee Ln
- 25719 Gamewood Ct
- 25730 Oakridge Forest Ln
- 25803 Oakridge Forest Ln
- 25842 Oakridge Forest Ln
- 510 Joshua Lee Ln
- 25718 Gamewood Ct