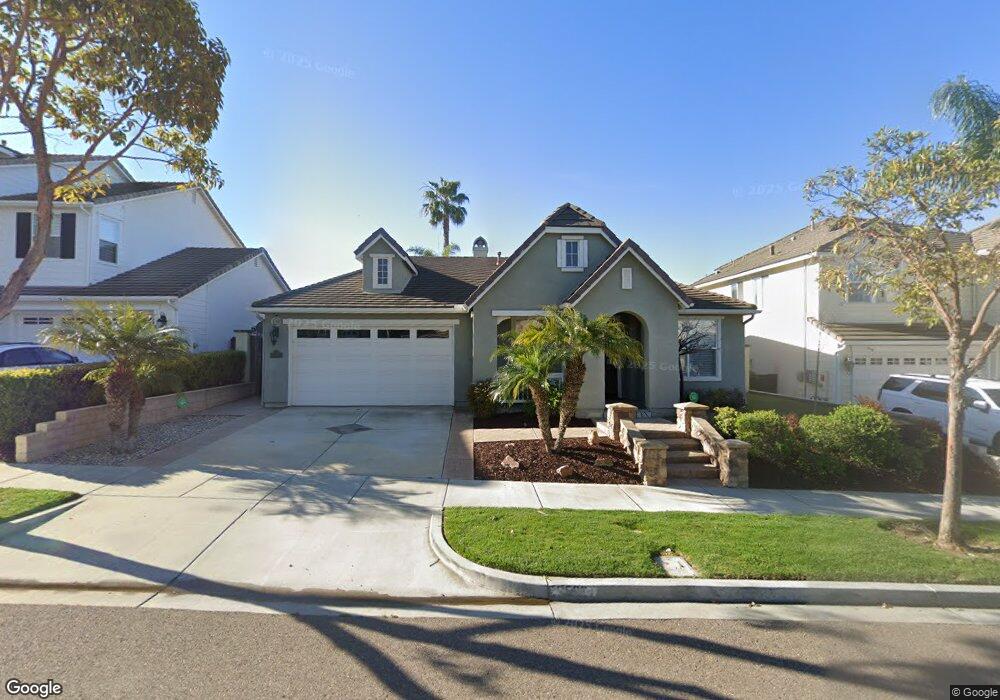
2583 Ingleton Ave Carlsbad, CA 92009
Bressi Ranch NeighborhoodEstimated Value: $1,737,000 - $2,067,000
3
Beds
3
Baths
2,544
Sq Ft
$743/Sq Ft
Est. Value
About This Home
This home is located at 2583 Ingleton Ave, Carlsbad, CA 92009 and is currently estimated at $1,889,438, approximately $742 per square foot. 2583 Ingleton Ave is a home located in San Diego County with nearby schools including Poinsettia Elementary School, Aviara Oaks Middle, and Sage Creek High.
Ownership History
Date
Name
Owned For
Owner Type
Purchase Details
Closed on
Sep 22, 2020
Sold by
Park Neil I and Park Ann L
Bought by
Park Neil I and Park Ann L
Current Estimated Value
Purchase Details
Closed on
Sep 13, 2012
Sold by
Sharif Steven J
Bought by
Park Neil I and Park Ann L
Home Financials for this Owner
Home Financials are based on the most recent Mortgage that was taken out on this home.
Original Mortgage
$416,999
Interest Rate
3.36%
Mortgage Type
New Conventional
Purchase Details
Closed on
Oct 30, 2007
Sold by
Sharif Steven J
Bought by
Sharif Steven J
Home Financials for this Owner
Home Financials are based on the most recent Mortgage that was taken out on this home.
Original Mortgage
$51,000
Interest Rate
6.4%
Mortgage Type
Stand Alone Refi Refinance Of Original Loan
Purchase Details
Closed on
Mar 13, 2006
Sold by
Greystone Homes Inc
Bought by
Sharif Steven J
Create a Home Valuation Report for This Property
The Home Valuation Report is an in-depth analysis detailing your home's value as well as a comparison with similar homes in the area
Home Values in the Area
Average Home Value in this Area
Purchase History
| Date | Buyer | Sale Price | Title Company |
|---|---|---|---|
| Park Neil I | -- | None Available | |
| Park Neil I | $635,000 | Ticor Title Company Of Ca | |
| Sharif Steven J | -- | Orange Coast Title Company | |
| Sharif Steven J | $725,000 | North American Title Co |
Source: Public Records
Mortgage History
| Date | Status | Borrower | Loan Amount |
|---|---|---|---|
| Previous Owner | Park Neil I | $416,999 | |
| Previous Owner | Sharif Steven J | $51,000 |
Source: Public Records
Tax History
| Year | Tax Paid | Tax Assessment Tax Assessment Total Assessment is a certain percentage of the fair market value that is determined by local assessors to be the total taxable value of land and additions on the property. | Land | Improvement |
|---|---|---|---|---|
| 2025 | $9,980 | $781,945 | $387,740 | $394,205 |
| 2024 | $9,980 | $766,614 | $380,138 | $386,476 |
| 2023 | $9,930 | $751,584 | $372,685 | $378,899 |
| 2022 | $9,809 | $736,848 | $365,378 | $371,470 |
| 2021 | $9,883 | $722,401 | $358,214 | $364,187 |
| 2020 | $9,826 | $714,994 | $354,541 | $360,453 |
| 2019 | $9,682 | $700,976 | $347,590 | $353,386 |
| 2018 | $9,352 | $687,232 | $340,775 | $346,457 |
| 2017 | $92 | $673,758 | $334,094 | $339,664 |
| 2016 | $8,932 | $660,548 | $327,544 | $333,004 |
| 2015 | $8,910 | $650,626 | $322,624 | $328,002 |
| 2014 | $8,786 | $637,882 | $316,305 | $321,577 |
Source: Public Records
Map
Nearby Homes
- 6140 Colt Place Unit 104
- 6058 Colt Place Unit 101
- 6626 Halite Place
- 6113 Paseo Granito Unit 70
- 6008 Paseo Salinero
- 6433 La Paloma St
- 3033 Rancho la Presa
- 6429 La Vanco Ct
- 6161 Paseo Tienda
- 2518 Unicornio St
- 3218 Rancho Reata
- 2718 Socorro Ln
- 6907 Quail Place Unit F
- 6901 Quail Place Unit A
- 6675 Agave Cir
- 2914 Carrillo Way
- 6934 Feldspar Place
- 6956 Sandpiper Place
- 1634 Fairlead Ave
- 2266 Aventurine Place
- 2579 Ingleton Ave
- 2587 Ingleton Ave
- 2578 Town Garden Rd
- 2582 Town Garden Rd
- 2575 Ingleton Ave
- 2574 Town Garden Rd
- 2584 Ingleton Ave
- 2580 Ingleton Ave
- 2570 Town Garden Rd
- 2571 Ingleton Ave
- 2576 Ingleton Ave
- 6226 Topiary St
- 6222 Topiary St
- 2566 Town Garden Rd
- 6218 Topiary St
- 6230 Topiary St
- 2572 Ingleton Ave
- 2567 Ingleton Ave
- 2581 Discovery Rd
- 2585 Discovery Rd
Your Personal Tour Guide
Ask me questions while you tour the home.