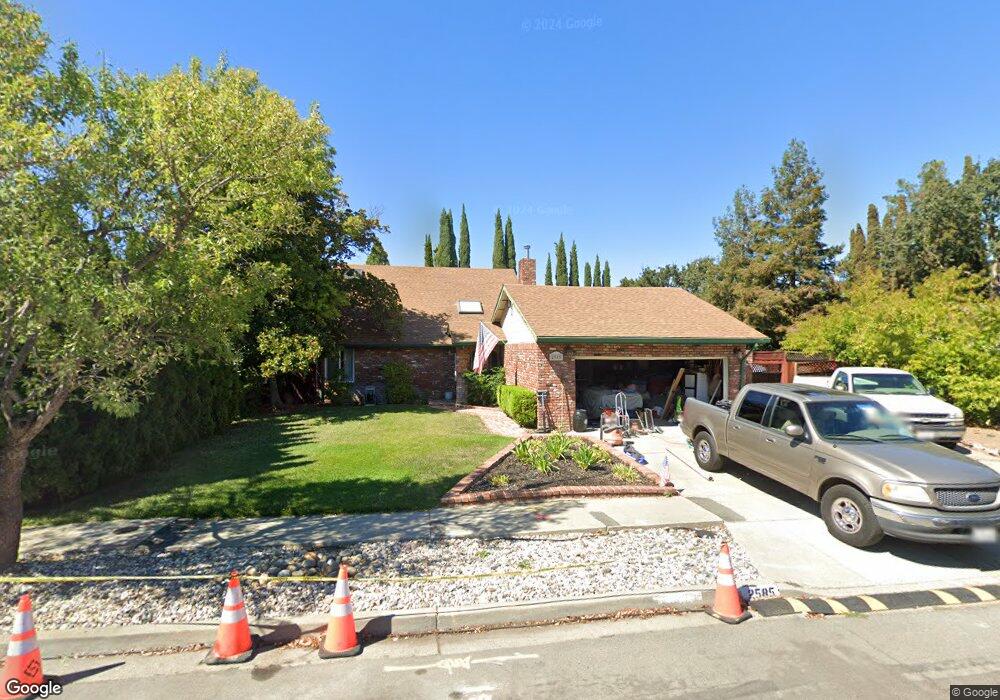
2585 Minert Rd Concord, CA 94518
Vista Diablo/Wilshire Estates NeighborhoodEstimated Value: $880,511 - $931,000
3
Beds
2
Baths
1,985
Sq Ft
$461/Sq Ft
Est. Value
About This Home
This home is located at 2585 Minert Rd, Concord, CA 94518 and is currently estimated at $914,378, approximately $460 per square foot. 2585 Minert Rd is a home located in Contra Costa County with nearby schools including Woodside Elementary School, Oak Grove Middle School, and Ygnacio Valley High School.
Ownership History
Date
Name
Owned For
Owner Type
Purchase Details
Closed on
Aug 23, 2016
Sold by
Daniels Brian and Daniels Monique S
Bought by
Daniels Brian and Daniels Monique S
Current Estimated Value
Purchase Details
Closed on
Mar 30, 2004
Sold by
Daniels Brian and Daniels Monique S
Bought by
Daniels Brian and Daniels Monique S
Purchase Details
Closed on
Apr 10, 1996
Sold by
Federal National Mortgage Association
Bought by
Daniels Brian and Daniels Monique S
Home Financials for this Owner
Home Financials are based on the most recent Mortgage that was taken out on this home.
Original Mortgage
$153,250
Outstanding Balance
$7,442
Interest Rate
7.68%
Mortgage Type
Seller Take Back
Estimated Equity
$906,936
Purchase Details
Closed on
Sep 27, 1995
Sold by
Source One Mtg Services Corp
Bought by
Federal National Mortgage Association
Purchase Details
Closed on
Sep 15, 1995
Sold by
Satary Michael
Bought by
Source One Mtg Services Corp
Create a Home Valuation Report for This Property
The Home Valuation Report is an in-depth analysis detailing your home's value as well as a comparison with similar homes in the area
Home Values in the Area
Average Home Value in this Area
Purchase History
| Date | Buyer | Sale Price | Title Company |
|---|---|---|---|
| Daniels Brian | -- | None Available | |
| Daniels Brian | -- | Fidelity National Title | |
| Daniels Brian | $158,000 | First American Title Guarant | |
| Federal National Mortgage Association | -- | Fidelity National Title Ins | |
| Source One Mtg Services Corp | $154,899 | Fidelity National Title Ins |
Source: Public Records
Mortgage History
| Date | Status | Borrower | Loan Amount |
|---|---|---|---|
| Open | Daniels Brian | $153,250 |
Source: Public Records
Tax History
| Year | Tax Paid | Tax Assessment Tax Assessment Total Assessment is a certain percentage of the fair market value that is determined by local assessors to be the total taxable value of land and additions on the property. | Land | Improvement |
|---|---|---|---|---|
| 2025 | $3,841 | $263,265 | $156,145 | $107,120 |
| 2024 | $3,640 | $258,104 | $153,084 | $105,020 |
| 2023 | $3,640 | $253,044 | $150,083 | $102,961 |
| 2022 | $3,572 | $248,084 | $147,141 | $100,943 |
| 2021 | $3,469 | $243,220 | $144,256 | $98,964 |
| 2019 | $3,390 | $236,008 | $139,978 | $96,030 |
| 2018 | $3,251 | $231,382 | $137,234 | $94,148 |
| 2017 | $3,130 | $226,846 | $134,544 | $92,302 |
| 2016 | $3,022 | $222,399 | $131,906 | $90,493 |
| 2015 | $2,963 | $219,059 | $129,925 | $89,134 |
| 2014 | -- | $214,768 | $127,380 | $87,388 |
Source: Public Records
Map
Nearby Homes
- 2605 Ryan Rd
- 2745 Minert Rd
- 3055 Treat Blvd Unit 36
- 810 Oak Grove Rd Unit 104
- 2036 Rockne Dr
- 825 Oak Grove Rd Unit 17
- 825 Oak Grove Rd Unit 46
- 825 Oak Grove Rd Unit 62
- 880 Madigan Ave
- 875 Brittany Ln
- 2840 Royal Ann Ln
- 2890 Treat Blvd Unit 5
- 1766 Risdon Rd
- 3181 Santa Maria Dr
- 1921 Gilly Ln
- 1036 Oak Grove Rd Unit 23
- 1036 Oak Grove Rd Unit 86
- 1036 Oak Grove Rd Unit 21
- 2055 Sierra Rd Unit 12
- 2055 Sierra Rd Unit 53
- 2575 Minert Rd
- 2595 Minert Rd
- 2605 Minert Rd
- 2600 Lyon Cir
- 2580 Minert Rd
- 2565 Minert Rd
- 2570 Minert Rd
- 2615 Minert Rd
- 2601 Lyon Cir
- 2606 Lyon Cir
- 2560 Minert Rd
- 2575 Beegum Ct
- 2607 Lyon Cir
- 2154 Charlotte Ave
- 2625 Minert Rd
- 2610 Minert Rd
- 870 Belann Ct
- 2172 Charlotte Ave
- 895 Belann Ct
- 2613 Lyon Cir
Your Personal Tour Guide
Ask me questions while you tour the home.