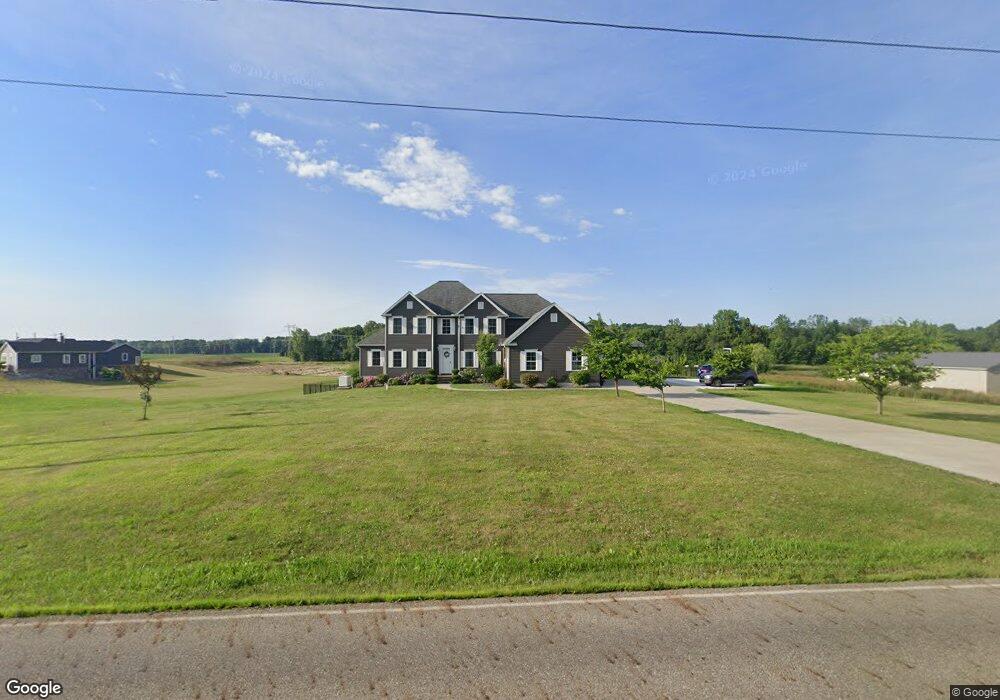
2586 Wright Rd NW Uniontown, OH 44685
Estimated Value: $720,000 - $1,083,531
5
Beds
5
Baths
4,486
Sq Ft
$201/Sq Ft
Est. Value
About This Home
This home is located at 2586 Wright Rd NW, Uniontown, OH 44685 and is currently estimated at $901,766, approximately $201 per square foot. 2586 Wright Rd NW is a home with nearby schools including North Canton Middle School, Hoover High School, and Mayfair Christian School.
Ownership History
Date
Name
Owned For
Owner Type
Purchase Details
Closed on
Apr 22, 2022
Sold by
Hudson Heather A and Lewis Heather A
Bought by
Hudson Heather A and Hudson Zachary Charles
Current Estimated Value
Purchase Details
Closed on
Feb 24, 2020
Sold by
Lewis Thomas B and Lewis Heather A
Bought by
Lewis Heather A
Home Financials for this Owner
Home Financials are based on the most recent Mortgage that was taken out on this home.
Original Mortgage
$507,600
Interest Rate
3.6%
Mortgage Type
New Conventional
Purchase Details
Closed on
Jul 19, 2011
Sold by
Liechty Jade D and Liechty Jill R
Bought by
Lewis Thomas B and Lewis Heather A
Home Financials for this Owner
Home Financials are based on the most recent Mortgage that was taken out on this home.
Original Mortgage
$59,850
Interest Rate
4.52%
Mortgage Type
New Conventional
Create a Home Valuation Report for This Property
The Home Valuation Report is an in-depth analysis detailing your home's value as well as a comparison with similar homes in the area
Home Values in the Area
Average Home Value in this Area
Purchase History
| Date | Buyer | Sale Price | Title Company |
|---|---|---|---|
| Hudson Heather A | -- | None Listed On Document | |
| Lewis Heather A | -- | None Available | |
| Lewis Thomas B | $66,500 | Attorney |
Source: Public Records
Mortgage History
| Date | Status | Borrower | Loan Amount |
|---|---|---|---|
| Previous Owner | Lewis Heather A | $507,600 | |
| Previous Owner | Lewis Thomas B | $59,850 |
Source: Public Records
Tax History
| Year | Tax Paid | Tax Assessment Tax Assessment Total Assessment is a certain percentage of the fair market value that is determined by local assessors to be the total taxable value of land and additions on the property. | Land | Improvement |
|---|---|---|---|---|
| 2025 | -- | $334,360 | $52,010 | $282,350 |
| 2024 | -- | $334,360 | $52,010 | $282,350 |
| 2023 | $13,508 | $255,010 | $36,330 | $218,680 |
| 2022 | $12,968 | $255,260 | $36,330 | $218,930 |
| 2021 | $13,343 | $255,260 | $36,330 | $218,930 |
| 2020 | $11,999 | $209,660 | $31,330 | $178,330 |
| 2019 | $10,987 | $205,070 | $31,330 | $173,740 |
| 2018 | $11,383 | $205,070 | $31,330 | $173,740 |
| 2017 | $9,628 | $182,710 | $27,900 | $154,810 |
| 2016 | $9,665 | $182,710 | $27,900 | $154,810 |
| 2015 | $9,697 | $182,710 | $27,900 | $154,810 |
| 2014 | $1,297 | $22,540 | $22,540 | $0 |
| 2013 | $649 | $22,540 | $22,540 | $0 |
Source: Public Records
Map
Nearby Homes
- 2776 Brouse St NW
- 1771 Midway St NW
- 3405 Dotwood St NW
- 1762 Charolais St NW
- 3248 State St NW
- 9520-9570 Cleveland Ave NW
- 1617 Charolais St NW
- 2480 State St NW
- 9364 Pheasant Valley Ave NW
- 2971 Chaderton Cir NW
- 9937 Southwyck Ave NW
- 2601 Lake Center St NW
- 3822 State St NW
- 3863 Heckman St NW
- 3878 Sprucehaven St NW
- 11105 Titus Ave NW
- 2287 Mcginty Rd NW
- 9856 Market Ave N
- 11931 Walton Cir NW
- 1170 Smith Kramer St NE
- 2577 Wright Rd NW
- 2595 Wright Rd NW
- 2557 Wright Rd NW
- 2644 Wright Rd NW
- 2617 Wright Rd NW
- 2637 Wright Rd NW
- 2655 Wright Rd NW
- 10395 Wright Rd NW
- 2525 Wright Rd NW
- 2780 Wright Rd NW
- 10127 Wagner Ave NW
- 2621 Eaver St NW
- 2661 Eaver St NW
- 2685 Eaver St NW
- 2844 Wright Rd NW
- 2707 Eaver St NW
- 2717 Eaver St NW
- 2574 Eaver St NW
- 2588 Eaver St NW
- 2608 Eaver St NW
Your Personal Tour Guide
Ask me questions while you tour the home.