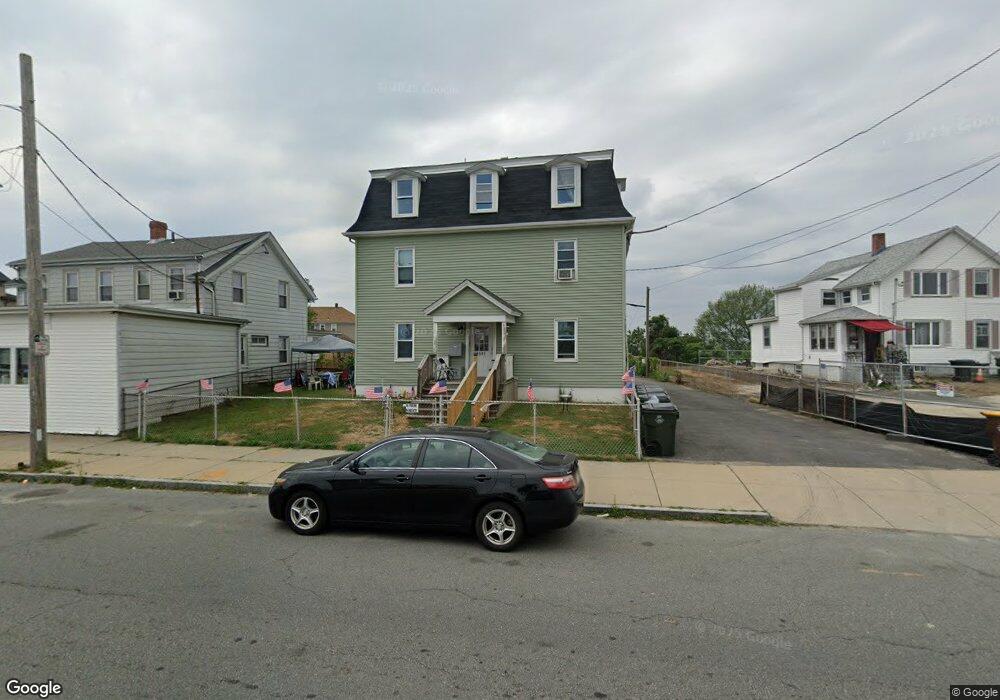
2589 S Main St Unit 2 Fall River, MA 02724
Sandy Beach NeighborhoodEstimated Value: $651,000 - $762,000
3
Beds
1
Bath
950
Sq Ft
$744/Sq Ft
Est. Value
About This Home
This home is located at 2589 S Main St Unit 2, Fall River, MA 02724 and is currently estimated at $706,667, approximately $743 per square foot. 2589 S Main St Unit 2 is a home located in Bristol County with nearby schools including Henry Lord Community School, B M C Durfee High School, and Argosy Collegiate Charter School.
Ownership History
Date
Name
Owned For
Owner Type
Purchase Details
Closed on
May 28, 2010
Sold by
Dobek Patricia M
Bought by
2589 S Main Street Llc
Current Estimated Value
Home Financials for this Owner
Home Financials are based on the most recent Mortgage that was taken out on this home.
Original Mortgage
$90,000
Outstanding Balance
$60,790
Interest Rate
5.13%
Mortgage Type
Purchase Money Mortgage
Estimated Equity
$645,877
Create a Home Valuation Report for This Property
The Home Valuation Report is an in-depth analysis detailing your home's value as well as a comparison with similar homes in the area
Home Values in the Area
Average Home Value in this Area
Purchase History
| Date | Buyer | Sale Price | Title Company |
|---|---|---|---|
| 2589 S Main Street Llc | $95,000 | -- |
Source: Public Records
Mortgage History
| Date | Status | Borrower | Loan Amount |
|---|---|---|---|
| Open | 2589 S Main Street Llc | $90,000 |
Source: Public Records
Tax History
| Year | Tax Paid | Tax Assessment Tax Assessment Total Assessment is a certain percentage of the fair market value that is determined by local assessors to be the total taxable value of land and additions on the property. | Land | Improvement |
|---|---|---|---|---|
| 2025 | $5,773 | $504,200 | $123,100 | $381,100 |
| 2024 | $5,538 | $482,000 | $118,500 | $363,500 |
| 2023 | $4,902 | $399,500 | $97,900 | $301,600 |
| 2022 | $4,420 | $350,200 | $93,300 | $256,900 |
| 2021 | $4,213 | $304,600 | $88,700 | $215,900 |
| 2020 | $4,823 | $266,000 | $87,400 | $178,600 |
| 2019 | $3,345 | $229,400 | $84,200 | $145,200 |
| 2018 | $5,264 | $223,700 | $91,200 | $132,500 |
| 2017 | $3,072 | $219,400 | $86,900 | $132,500 |
| 2016 | $3,027 | $222,100 | $92,500 | $129,600 |
| 2015 | $2,785 | $212,900 | $92,500 | $120,400 |
| 2014 | $2,768 | $220,000 | $89,800 | $130,200 |
Source: Public Records
Map
Nearby Homes
- 579 Summit St Unit 3
- 579 Summit St Unit 2
- 30 Broad St
- 391 Clarkson St
- 2229 S Main St
- 126 Wheeler St
- 616 Woodman St
- 39 Hilton St
- 25 Mathew Rd
- 29 Robert St
- 24 Valley St
- 15 Higgins St
- 17 Lynwood St
- 57 Larouche St
- 24 Bronson St
- 4 Bronson St
- 609 King Philip St
- 1852 S Main St
- 1846 S Main St
- 310 King Philip St
- 2589 S Main St
- 2599 S Main St
- 152 Last St
- 192 Last St
- 2553 S Main St
- 148 Last St Unit 3N
- 579 Summit St Unit 1
- 134 Last St Unit 2R
- 134 Last St Unit 1R
- 134 Last St Unit 3R
- 132 Last St Unit 3L
- 132 Last St Unit 2L
- 132 Last St Unit 1L
- 132 Last St Unit 1R
- 132 Last St Unit 3R
- 541 Summit St
- 2547 S Main St Unit 1N
- 2547 S Main St
- 366 Bayview St
- 2629 S Main St Unit 2
Your Personal Tour Guide
Ask me questions while you tour the home.