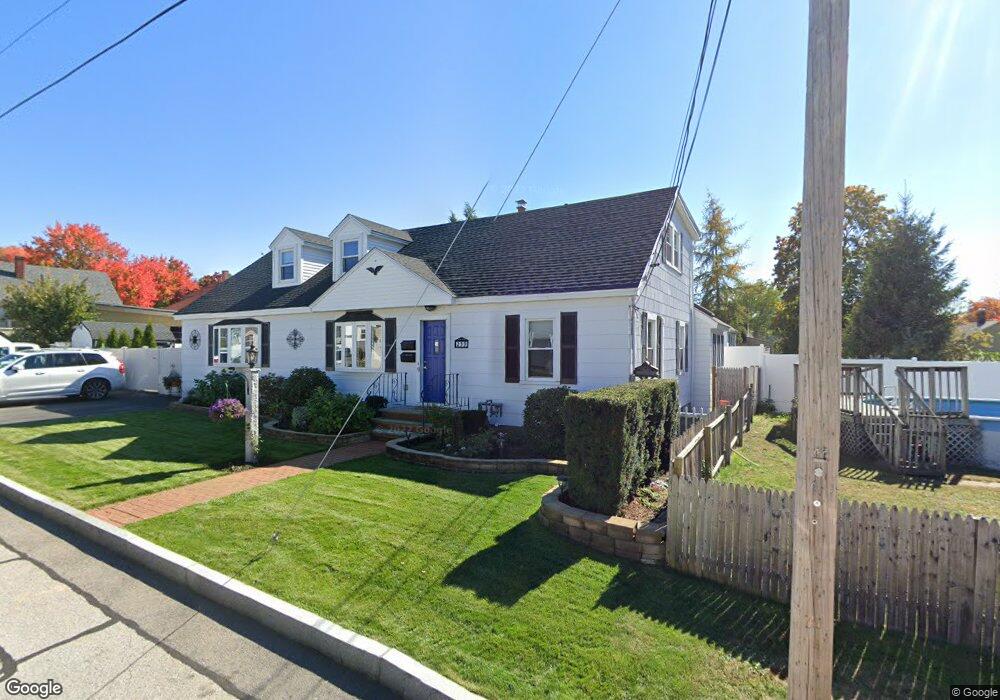
259 Brunelle Ave Manchester, NH 03103
Southside NeighborhoodEstimated Value: $482,371 - $567,000
4
Beds
4
Baths
1,376
Sq Ft
$371/Sq Ft
Est. Value
About This Home
This home is located at 259 Brunelle Ave, Manchester, NH 03103 and is currently estimated at $510,843, approximately $371 per square foot. 259 Brunelle Ave is a home located in Hillsborough County with nearby schools including Jewett Street Elementary School, Southside Middle School, and Manchester Memorial High School.
Ownership History
Date
Name
Owned For
Owner Type
Purchase Details
Closed on
Sep 16, 2024
Sold by
Trepanier Craig R and Trepanier Pamela J
Bought by
Trepanier Ft and Trepanier
Current Estimated Value
Purchase Details
Closed on
Jun 8, 2015
Sold by
Deschuiteneer Martin J
Bought by
Trepanier Crait and Trepanier Pamela
Home Financials for this Owner
Home Financials are based on the most recent Mortgage that was taken out on this home.
Original Mortgage
$180,180
Interest Rate
3.62%
Mortgage Type
New Conventional
Create a Home Valuation Report for This Property
The Home Valuation Report is an in-depth analysis detailing your home's value as well as a comparison with similar homes in the area
Home Values in the Area
Average Home Value in this Area
Purchase History
| Date | Buyer | Sale Price | Title Company |
|---|---|---|---|
| Trepanier Ft | -- | None Available | |
| Trepanier Ft | -- | None Available | |
| Trepanier Crait | $176,000 | -- | |
| Trepanier Crait | $176,000 | -- |
Source: Public Records
Mortgage History
| Date | Status | Borrower | Loan Amount |
|---|---|---|---|
| Previous Owner | Trepanier Crait | $180,180 | |
| Previous Owner | Trepanier Crait | $288,000 |
Source: Public Records
Tax History Compared to Growth
Tax History
| Year | Tax Paid | Tax Assessment Tax Assessment Total Assessment is a certain percentage of the fair market value that is determined by local assessors to be the total taxable value of land and additions on the property. | Land | Improvement |
|---|---|---|---|---|
| 2024 | $6,579 | $336,000 | $97,500 | $238,500 |
| 2023 | $6,337 | $336,000 | $97,500 | $238,500 |
| 2022 | $6,129 | $336,000 | $97,500 | $238,500 |
| 2021 | $5,940 | $336,000 | $97,500 | $238,500 |
| 2020 | $5,184 | $210,200 | $67,200 | $143,000 |
| 2019 | $5,112 | $210,200 | $67,200 | $143,000 |
| 2018 | $4,978 | $210,200 | $67,200 | $143,000 |
| 2017 | $4,902 | $210,200 | $67,200 | $143,000 |
| 2016 | $4,864 | $210,200 | $67,200 | $143,000 |
| 2015 | $4,442 | $189,500 | $62,200 | $127,300 |
| 2014 | $4,453 | $189,500 | $62,200 | $127,300 |
| 2013 | $4,296 | $189,500 | $62,200 | $127,300 |
Source: Public Records
Map
Nearby Homes