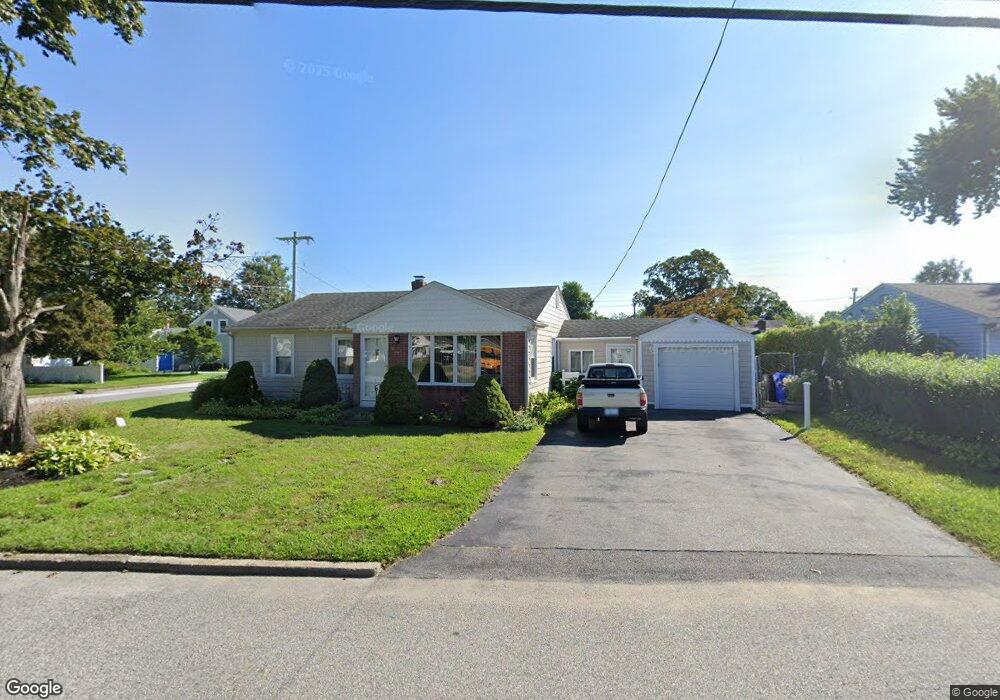
259 Burnside Ave Riverside, RI 02915
Riverside NeighborhoodEstimated Value: $439,802 - $470,000
3
Beds
2
Baths
1,980
Sq Ft
$229/Sq Ft
Est. Value
About This Home
This home is located at 259 Burnside Ave, Riverside, RI 02915 and is currently estimated at $453,451, approximately $229 per square foot. 259 Burnside Ave is a home located in Providence County with nearby schools including East Providence High School, St Mary Academy-Bay View, and St Luke Elementary School.
Ownership History
Date
Name
Owned For
Owner Type
Purchase Details
Closed on
Jun 1, 2015
Sold by
Cabral Maria L
Bought by
Cabral Luis A and Cabral Maria L
Current Estimated Value
Home Financials for this Owner
Home Financials are based on the most recent Mortgage that was taken out on this home.
Original Mortgage
$74,500
Outstanding Balance
$57,948
Interest Rate
3.87%
Estimated Equity
$395,503
Purchase Details
Closed on
Feb 3, 1997
Sold by
Ethier Lillian G
Bought by
Ferschke Jason R and Bileau Dawn M
Home Financials for this Owner
Home Financials are based on the most recent Mortgage that was taken out on this home.
Original Mortgage
$73,245
Interest Rate
7.65%
Mortgage Type
Purchase Money Mortgage
Create a Home Valuation Report for This Property
The Home Valuation Report is an in-depth analysis detailing your home's value as well as a comparison with similar homes in the area
Home Values in the Area
Average Home Value in this Area
Purchase History
| Date | Buyer | Sale Price | Title Company |
|---|---|---|---|
| Cabral Luis A | -- | -- | |
| Ferschke Jason R | $77,500 | -- | |
| Cabral Luis A | -- | -- | |
| Ferschke Jason R | $77,500 | -- |
Source: Public Records
Mortgage History
| Date | Status | Borrower | Loan Amount |
|---|---|---|---|
| Open | Ferschke Jason R | $74,500 | |
| Previous Owner | Ferschke Jason R | $73,245 |
Source: Public Records
Tax History Compared to Growth
Tax History
| Year | Tax Paid | Tax Assessment Tax Assessment Total Assessment is a certain percentage of the fair market value that is determined by local assessors to be the total taxable value of land and additions on the property. | Land | Improvement |
|---|---|---|---|---|
| 2025 | $5,976 | $457,200 | $127,200 | $330,000 |
| 2024 | $5,582 | $364,100 | $106,000 | $258,100 |
| 2023 | $5,374 | $364,100 | $106,000 | $258,100 |
| 2022 | $5,111 | $233,800 | $62,100 | $171,700 |
| 2021 | $5,027 | $233,800 | $57,000 | $176,800 |
| 2020 | $4,814 | $233,800 | $57,000 | $176,800 |
| 2019 | $4,681 | $233,800 | $57,000 | $176,800 |
| 2018 | $4,700 | $205,400 | $55,400 | $150,000 |
| 2017 | $4,595 | $205,400 | $55,400 | $150,000 |
| 2016 | $4,572 | $205,400 | $55,400 | $150,000 |
| 2015 | $4,340 | $189,100 | $51,400 | $137,700 |
| 2014 | $4,340 | $189,100 | $51,400 | $137,700 |
Source: Public Records
Map
Nearby Homes
- 36 Woodbine St
- 25 Woodbine St
- 74 Plum Rd
- 536 Willett Ave
- 25 Winslow St
- 25 Read St
- 57 Harris St
- 735 Willett Ave Unit 806
- 25 Arnold St
- 81 Sprague Ave
- 151 Willett Ave Unit 2
- 151 Willett Ave Unit 5
- 146 Becker Ave
- 6 Hilton Ave
- 81 Pine Crest Dr
- 83 Pine Crest Dr
- 46 Tanglewood Dr
- 17 Oak Ave
- 1 Fales St
- 33 Pine St Unit 35