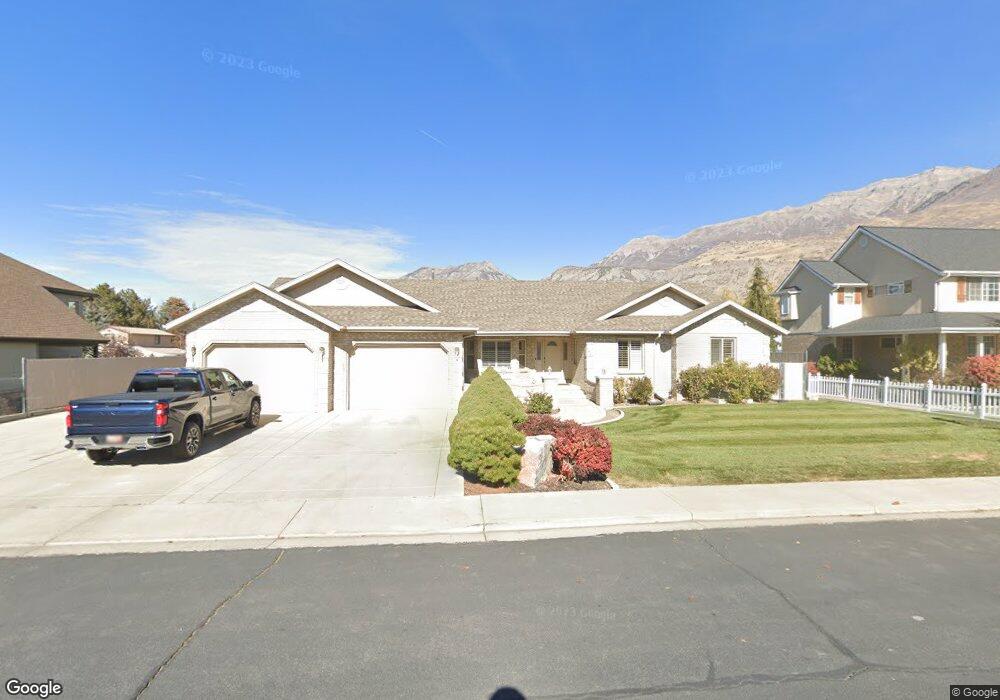
259 E 60 N Lindon, UT 84042
Estimated Value: $1,118,000 - $1,718,000
5
Beds
4
Baths
5,598
Sq Ft
$239/Sq Ft
Est. Value
About This Home
This home is located at 259 E 60 N, Lindon, UT 84042 and is currently estimated at $1,340,477, approximately $239 per square foot. 259 E 60 N is a home located in Utah County with nearby schools including Lindon Elementary School, Oak Canyon Junior High School, and Pleasant Grove High School.
Ownership History
Date
Name
Owned For
Owner Type
Purchase Details
Closed on
Apr 16, 2025
Sold by
Towne & Country Investments Llc
Bought by
Crowe Chris and Crowe Louise
Current Estimated Value
Purchase Details
Closed on
Nov 29, 2021
Sold by
Robert A Allman Trust
Bought by
Towne & Country Investments Llc
Purchase Details
Closed on
Jun 11, 2013
Sold by
Allman Robert A
Bought by
Allman Robert A
Create a Home Valuation Report for This Property
The Home Valuation Report is an in-depth analysis detailing your home's value as well as a comparison with similar homes in the area
Home Values in the Area
Average Home Value in this Area
Purchase History
| Date | Buyer | Sale Price | Title Company |
|---|---|---|---|
| Crowe Chris | -- | Prospect Title | |
| Towne & Country Investments Llc | -- | Inwest Title | |
| Allman Robert A | -- | None Available |
Source: Public Records
Tax History
| Year | Tax Paid | Tax Assessment Tax Assessment Total Assessment is a certain percentage of the fair market value that is determined by local assessors to be the total taxable value of land and additions on the property. | Land | Improvement |
|---|---|---|---|---|
| 2025 | $4,228 | $552,585 | -- | -- |
| 2024 | $4,228 | $521,235 | $0 | $0 |
| 2023 | $4,037 | $534,545 | $0 | $0 |
| 2022 | $4,039 | $516,615 | $0 | $0 |
| 2021 | $3,522 | $679,200 | $292,300 | $386,900 |
| 2020 | $3,242 | $615,600 | $243,600 | $372,000 |
| 2019 | $2,863 | $567,100 | $243,600 | $323,500 |
| 2018 | $2,968 | $554,300 | $230,800 | $323,500 |
| 2017 | $2,927 | $293,095 | $0 | $0 |
| 2016 | $2,967 | $274,780 | $0 | $0 |
| 2015 | $2,796 | $244,805 | $0 | $0 |
| 2014 | $2,418 | $209,770 | $0 | $0 |
Source: Public Records
Map
Nearby Homes
Your Personal Tour Guide
Ask me questions while you tour the home.