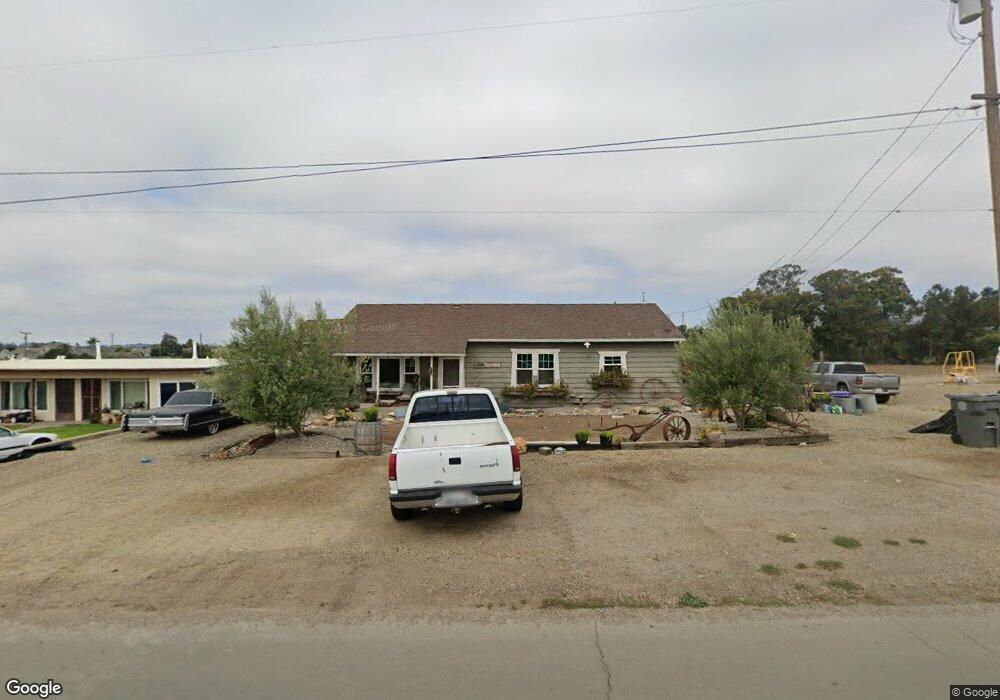
259 E Tefft St Nipomo, CA 93444
Estimated Value: $556,000 - $952,000
3
Beds
1
Bath
1,366
Sq Ft
$501/Sq Ft
Est. Value
About This Home
This home is located at 259 E Tefft St, Nipomo, CA 93444 and is currently estimated at $683,713, approximately $500 per square foot. 259 E Tefft St is a home located in San Luis Obispo County with nearby schools including Nipomo Elementary School, Mesa Middle School, and Nipomo High School.
Ownership History
Date
Name
Owned For
Owner Type
Purchase Details
Closed on
Jan 18, 2022
Sold by
Abatti Family Living Trust
Bought by
Abatti Family Living Trust
Current Estimated Value
Home Financials for this Owner
Home Financials are based on the most recent Mortgage that was taken out on this home.
Original Mortgage
$130,000
Outstanding Balance
$120,692
Interest Rate
3.69%
Mortgage Type
New Conventional
Estimated Equity
$563,021
Purchase Details
Closed on
Aug 18, 2008
Sold by
Abatti Demo and Abatti Joyce
Bought by
Abatti Delmo W and Abatti Joyce
Home Financials for this Owner
Home Financials are based on the most recent Mortgage that was taken out on this home.
Original Mortgage
$92,000
Interest Rate
6.37%
Mortgage Type
New Conventional
Purchase Details
Closed on
Feb 1, 1995
Sold by
Abatti Delmo and Abatti Delmo W
Bought by
Abatti Delmo and Abatti Joyce
Create a Home Valuation Report for This Property
The Home Valuation Report is an in-depth analysis detailing your home's value as well as a comparison with similar homes in the area
Home Values in the Area
Average Home Value in this Area
Purchase History
| Date | Buyer | Sale Price | Title Company |
|---|---|---|---|
| Abatti Family Living Trust | -- | First American Title | |
| Abatti Delmo W | -- | First American Title Company | |
| Abatti Delmo | -- | -- |
Source: Public Records
Mortgage History
| Date | Status | Borrower | Loan Amount |
|---|---|---|---|
| Open | Abatti Family Living Trust | $130,000 | |
| Previous Owner | Abatti Delmo W | $92,000 |
Source: Public Records
Tax History
| Year | Tax Paid | Tax Assessment Tax Assessment Total Assessment is a certain percentage of the fair market value that is determined by local assessors to be the total taxable value of land and additions on the property. | Land | Improvement |
|---|---|---|---|---|
| 2025 | $1,363 | $132,487 | $60,908 | $71,579 |
| 2024 | $1,347 | $129,890 | $59,714 | $70,176 |
| 2023 | $1,347 | $127,344 | $58,544 | $68,800 |
| 2022 | $1,327 | $124,848 | $57,397 | $67,451 |
| 2021 | $1,324 | $122,401 | $56,272 | $66,129 |
| 2020 | $1,309 | $121,146 | $55,695 | $65,451 |
| 2019 | $1,301 | $118,771 | $54,603 | $64,168 |
| 2018 | $1,286 | $116,443 | $53,533 | $62,910 |
| 2017 | $1,262 | $114,161 | $52,484 | $61,677 |
| 2016 | $1,190 | $111,923 | $51,455 | $60,468 |
| 2015 | $1,173 | $110,243 | $50,683 | $59,560 |
| 2014 | $1,129 | $108,085 | $49,691 | $58,394 |
Source: Public Records
Map
Nearby Homes
- 285 E Tefft St
- 247 E Branch St
- 239 E Branch St
- 195 E Tefft St
- 189 E Tefft St
- 195 E Chestnut St
- 150 E Chestnut St
- 1 W Branch St
- 0 S Burton St
- 90111003 W Price St
- 215 Rancho Rd
- 267 W Tefft St
- 136 Clearwater Ln
- 449 W Tefft St
- 449 W Tefft St Unit 23
- 449 W Tefft St Unit 22
- 449 W Tefft St Unit 13
- 160 San Antonio Ln
- 525 Grande Ave Unit D
- 571 S Oakglen Ave
- 253 E Tefft St
- 245 E Tefft St
- 248 E Tefft St
- 235 E Tefft St
- 240 E Tefft St
- 233 E Tefft St
- 238 E Tefft St
- 227 E Tefft St
- 234 E Tefft St
- 220 E Branch St
- 221 E Tefft St
- 230 E Tefft St
- 249 E Dana St
- 235 E Branch St
- 217 E Tefft St
- 245 E Dana St
- 226 E Tefft St
- 239 E Dana St
- 260 E Chestnut St
- 268 E Chestnut St
Your Personal Tour Guide
Ask me questions while you tour the home.