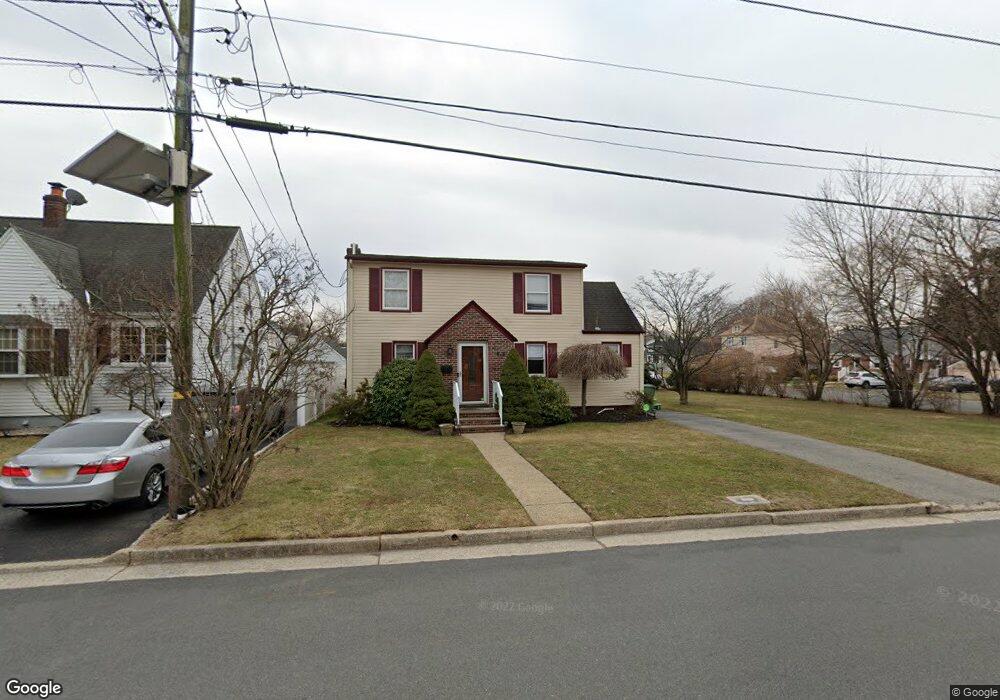
259 Hoover Ave Edison, NJ 08837
Estimated Value: $503,000 - $677,000
--
Bed
--
Bath
1,320
Sq Ft
$457/Sq Ft
Est. Value
About This Home
This home is located at 259 Hoover Ave, Edison, NJ 08837 and is currently estimated at $602,935, approximately $456 per square foot. 259 Hoover Ave is a home located in Middlesex County with nearby schools including James Monroe Elementary School, Herbert Hoover Middle School, and Edison High School.
Ownership History
Date
Name
Owned For
Owner Type
Purchase Details
Closed on
May 18, 2011
Sold by
Dudek Dennis A and Dudek Jamie R
Bought by
Dudek Dennis A and Dudek Jamie R
Current Estimated Value
Home Financials for this Owner
Home Financials are based on the most recent Mortgage that was taken out on this home.
Original Mortgage
$233,000
Outstanding Balance
$88,843
Interest Rate
4.6%
Mortgage Type
New Conventional
Estimated Equity
$514,092
Purchase Details
Closed on
Mar 28, 1994
Sold by
Est Of Emily Johnson
Bought by
Cimino James
Create a Home Valuation Report for This Property
The Home Valuation Report is an in-depth analysis detailing your home's value as well as a comparison with similar homes in the area
Home Values in the Area
Average Home Value in this Area
Purchase History
| Date | Buyer | Sale Price | Title Company |
|---|---|---|---|
| Dudek Dennis A | -- | Linear Title & Closing | |
| Cimino James | $165,000 | -- |
Source: Public Records
Mortgage History
| Date | Status | Borrower | Loan Amount |
|---|---|---|---|
| Open | Dudek Dennis A | $233,000 |
Source: Public Records
Tax History Compared to Growth
Tax History
| Year | Tax Paid | Tax Assessment Tax Assessment Total Assessment is a certain percentage of the fair market value that is determined by local assessors to be the total taxable value of land and additions on the property. | Land | Improvement |
|---|---|---|---|---|
| 2025 | $10,846 | $182,200 | $100,000 | $82,200 |
| 2024 | $10,788 | $182,200 | $100,000 | $82,200 |
| 2023 | $10,788 | $182,200 | $100,000 | $82,200 |
| 2022 | $10,792 | $182,200 | $100,000 | $82,200 |
| 2021 | $9,280 | $157,200 | $75,000 | $82,200 |
| 2020 | $9,195 | $157,200 | $75,000 | $82,200 |
| 2019 | $8,677 | $157,200 | $75,000 | $82,200 |
| 2018 | $8,526 | $157,200 | $75,000 | $82,200 |
| 2017 | $8,447 | $157,200 | $75,000 | $82,200 |
| 2016 | $8,294 | $157,200 | $75,000 | $82,200 |
| 2015 | $7,976 | $157,200 | $75,000 | $82,200 |
| 2014 | $7,744 | $157,200 | $75,000 | $82,200 |
Source: Public Records
Map
Nearby Homes
- 162 Brower Ave
- 212 Echo Ave
- 191 Hoover Ave
- 37 Garfield Park Unit B
- 951 953 Amboy Ave
- 951-953 Amboy Ave
- 42 Macarthur Dr
- 23 Montview Rd
- 62 Macarthur Dr
- 103 Liddle Ave
- 71 Liddle Ave
- 52 Macarthur Dr
- 81 Liddle Ave
- 902 Amboy Ave Unit 7
- 28 Plymouth Place
- 1 Hallo St
- 25 Eileen Way
- 62 Harmon Rd
- 385 Pierson Ave
- 84 Heman St