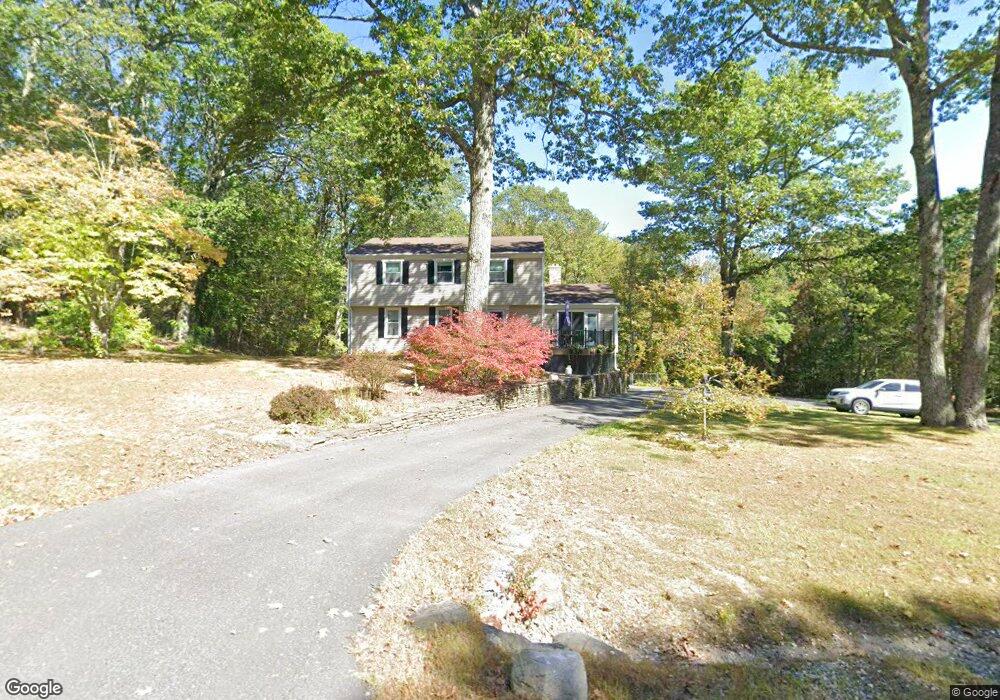
259 Northwest Rd Westhampton, MA 01027
Estimated Value: $496,407 - $579,000
4
Beds
3
Baths
2,352
Sq Ft
$224/Sq Ft
Est. Value
About This Home
This home is located at 259 Northwest Rd, Westhampton, MA 01027 and is currently estimated at $526,352, approximately $223 per square foot. 259 Northwest Rd is a home located in Hampshire County with nearby schools including Hampshire Regional High School.
Ownership History
Date
Name
Owned For
Owner Type
Purchase Details
Closed on
Jul 25, 2008
Sold by
Paquette Richard A and Paquette Wendy
Bought by
Szwajkowski Jeanne M and Szwajkowski Joseph M
Current Estimated Value
Home Financials for this Owner
Home Financials are based on the most recent Mortgage that was taken out on this home.
Original Mortgage
$256,950
Interest Rate
6.35%
Mortgage Type
Purchase Money Mortgage
Purchase Details
Closed on
Jun 25, 2002
Sold by
Percy Thomas Britton
Bought by
Paquette Richard A
Purchase Details
Closed on
Sep 15, 1999
Sold by
Leblanc Stephen P and Leblanc Susan
Bought by
Kindt Rebecca A and Percy Thomas Britton
Purchase Details
Closed on
Oct 31, 1995
Sold by
Harmon Charles Ronald
Bought by
Leblanc Stephen P and Leblanc Susan
Create a Home Valuation Report for This Property
The Home Valuation Report is an in-depth analysis detailing your home's value as well as a comparison with similar homes in the area
Home Values in the Area
Average Home Value in this Area
Purchase History
| Date | Buyer | Sale Price | Title Company |
|---|---|---|---|
| Szwajkowski Jeanne M | $285,500 | -- | |
| Paquette Richard A | $168,500 | -- | |
| Kindt Rebecca A | $163,000 | -- | |
| Leblanc Stephen P | $138,000 | -- |
Source: Public Records
Mortgage History
| Date | Status | Borrower | Loan Amount |
|---|---|---|---|
| Open | Leblanc Stephen P | $255,200 | |
| Closed | Szwajkowski Jeanne M | $256,950 | |
| Previous Owner | Leblanc Stephen P | $26,000 |
Source: Public Records
Tax History
| Year | Tax Paid | Tax Assessment Tax Assessment Total Assessment is a certain percentage of the fair market value that is determined by local assessors to be the total taxable value of land and additions on the property. | Land | Improvement |
|---|---|---|---|---|
| 2025 | $6,287 | $302,400 | $78,400 | $224,000 |
| 2024 | $6,257 | $302,400 | $78,400 | $224,000 |
| 2023 | $6,091 | $302,600 | $78,400 | $224,200 |
| 2022 | $5,901 | $288,000 | $78,400 | $209,600 |
| 2021 | $5,662 | $274,300 | $78,400 | $195,900 |
| 2020 | $5,990 | $294,800 | $78,400 | $216,400 |
| 2019 | $5,884 | $290,000 | $78,400 | $211,600 |
| 2018 | $5,635 | $290,000 | $78,400 | $211,600 |
| 2017 | $5,528 | $286,300 | $78,400 | $207,900 |
| 2016 | $5,411 | $286,300 | $78,400 | $207,900 |
| 2015 | $5,108 | $279,900 | $78,400 | $201,500 |
Source: Public Records
Map
Nearby Homes
- 296 Northwest Rd
- 134 Indian Hollow Rd
- 00 Northwest Rd
- 254 Bryant St
- 0 Stage Rd Unit 73433439
- Off Bryant St
- off Bryant St
- 63 Sugar Hill Rd
- 87 Southampton Rd
- 279 Goss Hill Rd
- 127 Pond Brook Rd
- 31 North Rd
- 6 Blueberry Ln
- 20-11 Sylvester Rd
- 0 Goss Hill Road Kimball Rd Unit 73451402
- 0 Kimball Rd
- 12 Pine Rd
- 404 Sylvester Rd
- 200 Easthampton Rd
- 16 Knightville Dam Rd
- 267 Northwest Rd
- 269 Northwest Rd
- 253 Northwest Rd
- 271 Northwest Rd
- 245 Northwest Rd
- 248 Northwest Rd
- 278 Northwest Rd
- 242 Northwest Rd
- 235 Northwest Rd
- 15 Pisgah Rd
- 284 Northwest Rd
- 290 Northwest Rd
- 285 Northwest Rd
- 230 Northwest Rd
- 231 Northwest Rd
- 0 Pisgah Rd
- 223 Northwest Rd
- 295 Northwest Rd
- 221 Northwest Rd
- 310 Northwest Rd
Your Personal Tour Guide
Ask me questions while you tour the home.