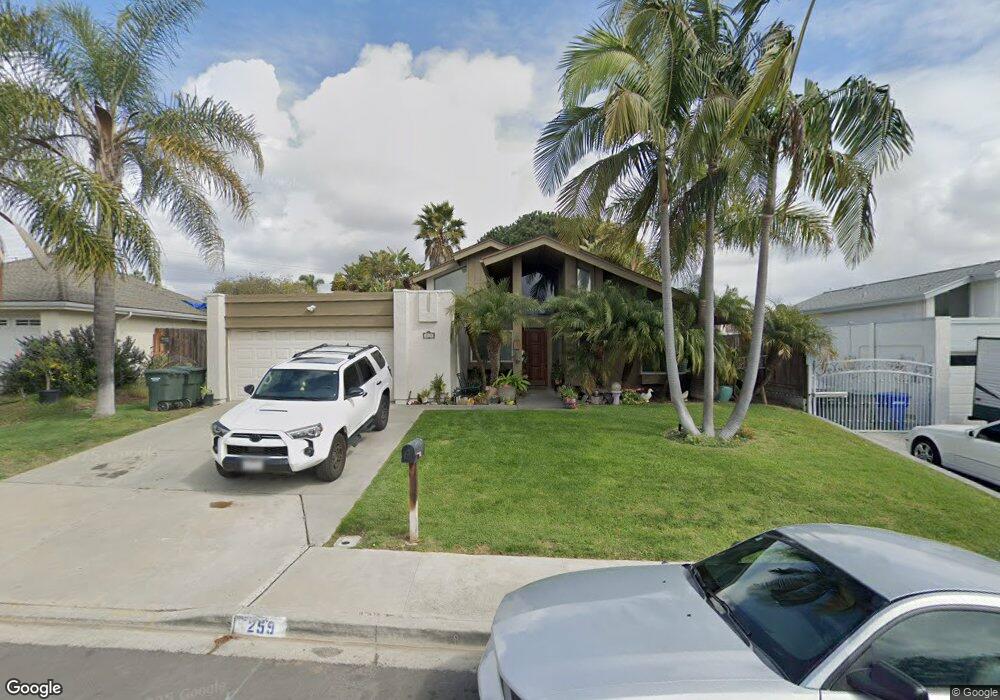
259 Sharp Place Encinitas, CA 92024
Central Encinitas NeighborhoodEstimated Value: $1,457,000 - $1,721,000
3
Beds
2
Baths
1,830
Sq Ft
$865/Sq Ft
Est. Value
About This Home
This home is located at 259 Sharp Place, Encinitas, CA 92024 and is currently estimated at $1,583,272, approximately $865 per square foot. 259 Sharp Place is a home located in San Diego County with nearby schools including Park Dale Lane Elementary, Diegueno Middle School, and La Costa Canyon High School.
Ownership History
Date
Name
Owned For
Owner Type
Purchase Details
Closed on
Feb 2, 1999
Sold by
Addison Paul W and Addison Linda J
Bought by
Addison Paul W and Addison Linda J
Current Estimated Value
Purchase Details
Closed on
Apr 24, 1998
Sold by
Bonanno John P and Bonanno Nancy A
Bought by
Addison Paul W and Addison Linda J
Home Financials for this Owner
Home Financials are based on the most recent Mortgage that was taken out on this home.
Original Mortgage
$155,000
Outstanding Balance
$29,501
Interest Rate
7.13%
Estimated Equity
$1,553,771
Purchase Details
Closed on
Jan 11, 1994
Sold by
Filshtinsky Michael and Filshtinsky Lena
Bought by
Bonanno John P and Bonanno Nancy A
Home Financials for this Owner
Home Financials are based on the most recent Mortgage that was taken out on this home.
Original Mortgage
$166,500
Interest Rate
7.21%
Purchase Details
Closed on
Oct 10, 1989
Purchase Details
Closed on
Jun 27, 1989
Purchase Details
Closed on
Aug 12, 1988
Create a Home Valuation Report for This Property
The Home Valuation Report is an in-depth analysis detailing your home's value as well as a comparison with similar homes in the area
Home Values in the Area
Average Home Value in this Area
Purchase History
| Date | Buyer | Sale Price | Title Company |
|---|---|---|---|
| Addison Paul W | -- | -- | |
| Addison Paul W | $255,000 | United Title Company | |
| Bonanno John P | $185,000 | Commonwealth Land Title Co | |
| -- | $261,500 | -- | |
| -- | $248,100 | -- | |
| -- | $189,000 | -- |
Source: Public Records
Mortgage History
| Date | Status | Borrower | Loan Amount |
|---|---|---|---|
| Open | Addison Paul W | $155,000 | |
| Previous Owner | Bonanno John P | $166,500 |
Source: Public Records
Tax History
| Year | Tax Paid | Tax Assessment Tax Assessment Total Assessment is a certain percentage of the fair market value that is determined by local assessors to be the total taxable value of land and additions on the property. | Land | Improvement |
|---|---|---|---|---|
| 2025 | $4,863 | $407,148 | $183,614 | $223,534 |
| 2024 | $4,863 | $399,165 | $180,014 | $219,151 |
| 2023 | $4,705 | $391,339 | $176,485 | $214,854 |
| 2022 | $4,579 | $383,667 | $173,025 | $210,642 |
| 2021 | $4,489 | $376,145 | $169,633 | $206,512 |
| 2020 | $4,404 | $372,289 | $167,894 | $204,395 |
| 2019 | $4,321 | $364,990 | $164,602 | $200,388 |
| 2018 | $4,255 | $357,834 | $161,375 | $196,459 |
| 2017 | $4,185 | $350,818 | $158,211 | $192,607 |
| 2016 | $4,063 | $343,940 | $155,109 | $188,831 |
| 2015 | $3,980 | $338,775 | $152,780 | $185,995 |
| 2014 | $3,879 | $332,140 | $149,788 | $182,352 |
Source: Public Records
Map
Nearby Homes
- 1517 Shields Ave
- 1617 Blossom Field Way
- 1642 Blossom Field Way
- 1709 Edgefield Ln
- 114 Cerro St
- 1733 Gentle Breeze Ln
- 1824 Eastwood Ln
- 1830 Gatepost Rd
- 1105 Catania Ct Unit 201
- 804 & 814 Clark Ave
- 3736 38 Via Rancho Michelle
- 200 202 Neptune Ave
- 772 Conestoga Ct
- 250 258 Hillcrest Dr
- 608 Crest Dr
- 1644 Forestdale Dr
- 1986 Azure Way Unit 107
- 324 Countrywood Ln
- 349 Horizon Dr
- 1741 Charleston Ln
- 267 Sharp Place
- 255 Sharp Place
- 283 Sharp Place
- 1546 Traske Rd
- 251 Sharp Place
- 1602 Traske Rd
- 262 Sharp Place
- 258 Sharp Place
- 287 Sharp Place
- 266 Sharp Place
- 254 Sharp Place
- 1610 Traske Rd
- 278 Sharp Place
- 250 Sharp Place
- 291 Sharp Place
- 270 Sharp Place
- 274 Sharp Place
- 286 Sharp Place
- 267 Turner Ave
- 1618 Traske Rd
Your Personal Tour Guide
Ask me questions while you tour the home.