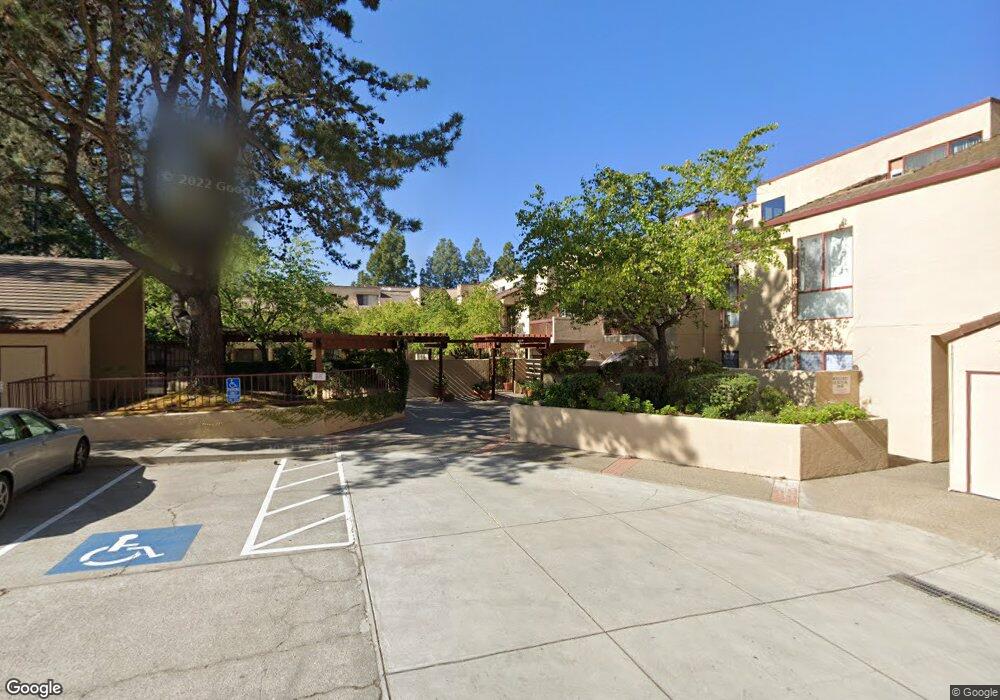
25912 Hayward Blvd Unit 203 Hayward, CA 94542
Hayward Highland NeighborhoodEstimated Value: $526,000 - $805,002
3
Beds
3
Baths
1,922
Sq Ft
$352/Sq Ft
Est. Value
About This Home
This home is located at 25912 Hayward Blvd Unit 203, Hayward, CA 94542 and is currently estimated at $677,501, approximately $352 per square foot. 25912 Hayward Blvd Unit 203 is a home located in Alameda County with nearby schools including Stonebrae Elementary School, Bret Harte Middle School, and Hayward High School.
Ownership History
Date
Name
Owned For
Owner Type
Purchase Details
Closed on
May 13, 2021
Sold by
Tallapaneni Sreedhar and Tallapaneni Prasanthi
Bought by
Tallapaneni Sreedhar and Tallapaneni Prasanthi
Current Estimated Value
Purchase Details
Closed on
Oct 10, 2012
Sold by
Santos Frank B and Santos Jeanette C
Bought by
Tallapaneni Sreedhar and Tallapaneni Prasanthi
Purchase Details
Closed on
Jul 25, 2005
Sold by
Intervi Harvey Velma Faye
Bought by
Santos Frank B and Santos Jeanette C
Home Financials for this Owner
Home Financials are based on the most recent Mortgage that was taken out on this home.
Original Mortgage
$405,600
Interest Rate
1.37%
Mortgage Type
Negative Amortization
Purchase Details
Closed on
Nov 24, 1998
Sold by
Faye Harvey and Faye Velma Faye
Bought by
Harvey Velma Faye
Create a Home Valuation Report for This Property
The Home Valuation Report is an in-depth analysis detailing your home's value as well as a comparison with similar homes in the area
Home Values in the Area
Average Home Value in this Area
Purchase History
| Date | Buyer | Sale Price | Title Company |
|---|---|---|---|
| Tallapaneni Sreedhar | -- | None Available | |
| Tallapaneni Sreedhar | $223,500 | None Available | |
| Santos Frank B | $507,000 | Fidelity National Title Co | |
| Harvey Velma Faye | -- | -- |
Source: Public Records
Mortgage History
| Date | Status | Borrower | Loan Amount |
|---|---|---|---|
| Previous Owner | Santos Frank B | $405,600 |
Source: Public Records
Tax History Compared to Growth
Tax History
| Year | Tax Paid | Tax Assessment Tax Assessment Total Assessment is a certain percentage of the fair market value that is determined by local assessors to be the total taxable value of land and additions on the property. | Land | Improvement |
|---|---|---|---|---|
| 2025 | $4,520 | $357,100 | $107,130 | $249,970 |
| 2024 | $4,520 | $350,098 | $105,029 | $245,069 |
| 2023 | $4,454 | $343,234 | $102,970 | $240,264 |
| 2022 | $4,370 | $336,507 | $100,952 | $235,555 |
| 2021 | $4,336 | $329,908 | $98,972 | $230,936 |
| 2020 | $4,289 | $326,527 | $97,958 | $228,569 |
| 2019 | $4,323 | $320,127 | $96,038 | $224,089 |
| 2018 | $4,065 | $313,851 | $94,155 | $219,696 |
| 2017 | $3,974 | $307,698 | $92,309 | $215,389 |
| 2016 | $3,741 | $301,666 | $90,500 | $211,166 |
| 2015 | $3,668 | $297,136 | $89,141 | $207,995 |
| 2014 | $3,489 | $291,315 | $87,394 | $203,921 |
Source: Public Records
Map
Nearby Homes
- 25912 Hayward Blvd Unit 106
- 2151 Brandywine Place
- 2108 Thistle Ct
- 2419 Saint Helena Dr Unit 6
- 2437 Saint Helena Dr Unit 3
- 0 Chronicle Ave Unit 41091503
- 2703 Tribune Ave
- 2485 Saint Helena Dr Unit 3
- 0 Morse Ct Unit 41105392
- 25265 Morse Ct
- 26843 New Dobbel Ave
- 25091 Oakridge Ct
- 24948 Campus Dr
- 2833 Colony View Place
- 24946 Bland St
- 24930 2nd St
- 1 Nina St
- 26412 Chatham Ct
- 27030 Parkside Dr
- 25910 Westview Way
- 25912 Hayward Blvd Unit 215
- 25912 Hayward Blvd
- 25912 Hayward Blvd Unit 104
- 25912 Hayward Blvd Unit 210
- 25912 Hayward Blvd Unit 301
- 25912 Hayward Blvd Unit 318
- 25912 Hayward Blvd Unit 217
- 25912 Hayward Blvd Unit 310
- 25912 Hayward Blvd Unit 110
- 25912 Hayward Blvd Unit 314
- 25912 Hayward Blvd Unit 217
- 25912 Hayward Blvd Unit 113
- 25912 Hayward Blvd Unit 109
- 25912 Hayward Blvd Unit 218
- 25912 Hayward Blvd Unit 103
- 25912 Hayward Blvd Unit 212
- 25912 Hayward Blvd Unit 102
- 25912 Hayward Blvd Unit 101
- 25912 Hayward Blvd Unit 316
- 25912 Hayward Blvd Unit 302