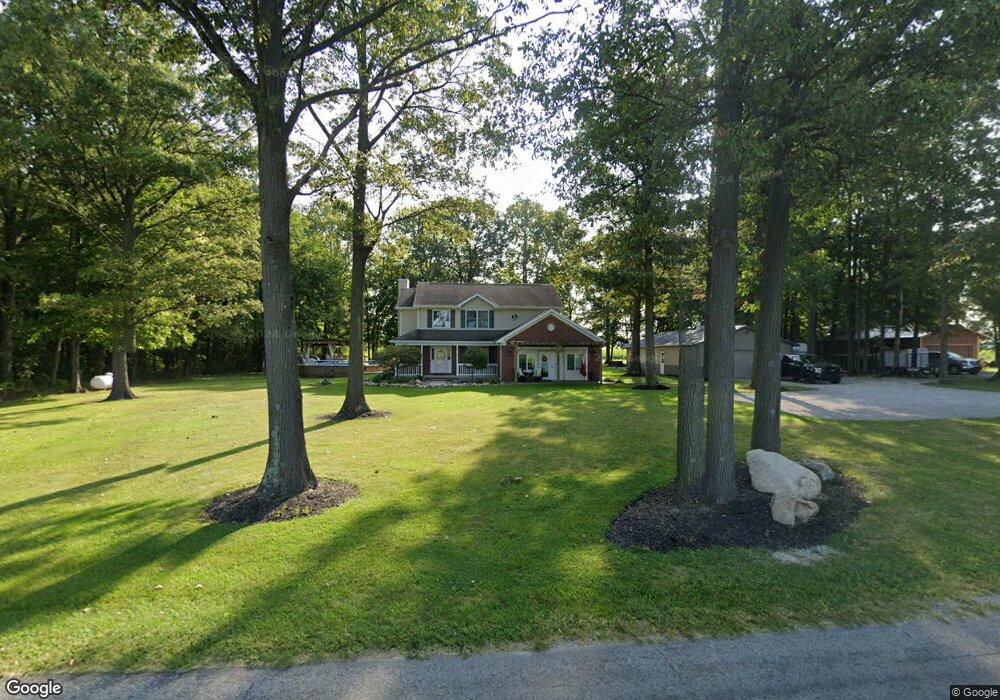
25921 Anthony Rd Arcadia, IN 46030
Estimated Value: $523,000 - $566,000
4
Beds
3
Baths
2,341
Sq Ft
$230/Sq Ft
Est. Value
About This Home
This home is located at 25921 Anthony Rd, Arcadia, IN 46030 and is currently estimated at $539,088, approximately $230 per square foot. 25921 Anthony Rd is a home located in Hamilton County.
Ownership History
Date
Name
Owned For
Owner Type
Purchase Details
Closed on
Aug 23, 2021
Sold by
Schroeder Samuel L
Bought by
Schroeder Samuel L
Current Estimated Value
Home Financials for this Owner
Home Financials are based on the most recent Mortgage that was taken out on this home.
Original Mortgage
$337,071
Outstanding Balance
$302,670
Interest Rate
2.8%
Mortgage Type
FHA
Estimated Equity
$236,418
Purchase Details
Closed on
Aug 30, 2007
Sold by
Cherry Chad A and Cherry Chanelle L
Bought by
Schroeder Samuel L
Home Financials for this Owner
Home Financials are based on the most recent Mortgage that was taken out on this home.
Original Mortgage
$229,900
Interest Rate
6.72%
Mortgage Type
Purchase Money Mortgage
Create a Home Valuation Report for This Property
The Home Valuation Report is an in-depth analysis detailing your home's value as well as a comparison with similar homes in the area
Purchase History
We collect this data history from publicly available records. To have your information removed, we recommend requesting removal directly through your county’s website.
| Date | Buyer | Sale Price | Title Company |
|---|---|---|---|
| Schroeder Samuel L | -- | Cooper Title Llc | |
| Schroeder Samuel L | -- | Stewart Title |
Source: Public Records
Mortgage History
We collect this data history from publicly available records. To have your information removed, we recommend requesting removal directly through your county’s website.
| Date | Status | Borrower | Loan Amount |
|---|---|---|---|
| Open | Schroeder Samuel L | $337,071 | |
| Closed | Schroeder Samuel L | $229,900 |
Source: Public Records
Tax History
| Year | Tax Paid | Tax Assessment Tax Assessment Total Assessment is a certain percentage of the fair market value that is determined by local assessors to be the total taxable value of land and additions on the property. | Land | Improvement |
|---|---|---|---|---|
| 2025 | $3,169 | $370,100 | $74,900 | $295,200 |
| 2024 | $3,095 | $344,900 | $74,900 | $270,000 |
| 2023 | $3,110 | $329,000 | $74,900 | $254,100 |
| 2022 | $2,634 | $279,700 | $74,100 | $205,600 |
| 2021 | $2,569 | $265,300 | $74,100 | $191,200 |
| 2020 | $2,352 | $251,400 | $74,100 | $177,300 |
| 2019 | $2,269 | $248,500 | $37,100 | $211,400 |
| 2018 | $2,252 | $242,600 | $37,100 | $205,500 |
| 2017 | $2,059 | $226,200 | $37,100 | $189,100 |
| 2016 | $1,904 | $211,900 | $37,100 | $174,800 |
| 2014 | $1,581 | $192,200 | $34,200 | $158,000 |
| 2013 | $1,581 | $186,000 | $34,200 | $151,800 |
Source: Public Records
Map
Nearby Homes
- 24995 Anthony Rd
- 3558 E 246th St
- 5029 E 246th St
- 1592 E 236th St
- 1119 E 234th St
- 26211 Scherer Ave
- 23104 Sonoma Ln
- 544 Wise Way
- 565 Melbrook St
- 501 E Main St
- 27 Karner Blue Ct
- 47 Karner Blue Ct
- 25 Karner Blue Ct
- 23 Karner Blue Ct
- 7860 W 600 S
- 213 W South St
- 23518 Oak Ridge Rd
- 1035 Coral Springs Dr
- 0 W 246th St Unit MBR22071181
- 117 Cottonwood Dr
- 25911 Anthony Rd
- 25859 Anthony Rd
- 26135 Anthony Rd
- 25857 Anthony Rd
- 25770 Anthony Rd
- 26090 Salem Church Rd
- 26158 Salem Church Rd
- 26279 Anthony Rd
- 26440 Anthony Rd
- 26319 Anthony Rd
- 25910 Salem Church Rd
- 25850 Salem Rd
- 26001 N Salem Rd
- 25610 Salem Rd
- 3410 E 256th St
- 3542 E 256th St
- 3590 E 256th St
- 26510 Salem Rd
- 26510 N Salem Rd
- 3311 E 266th St
Your Personal Tour Guide
Ask me questions while you tour the home.