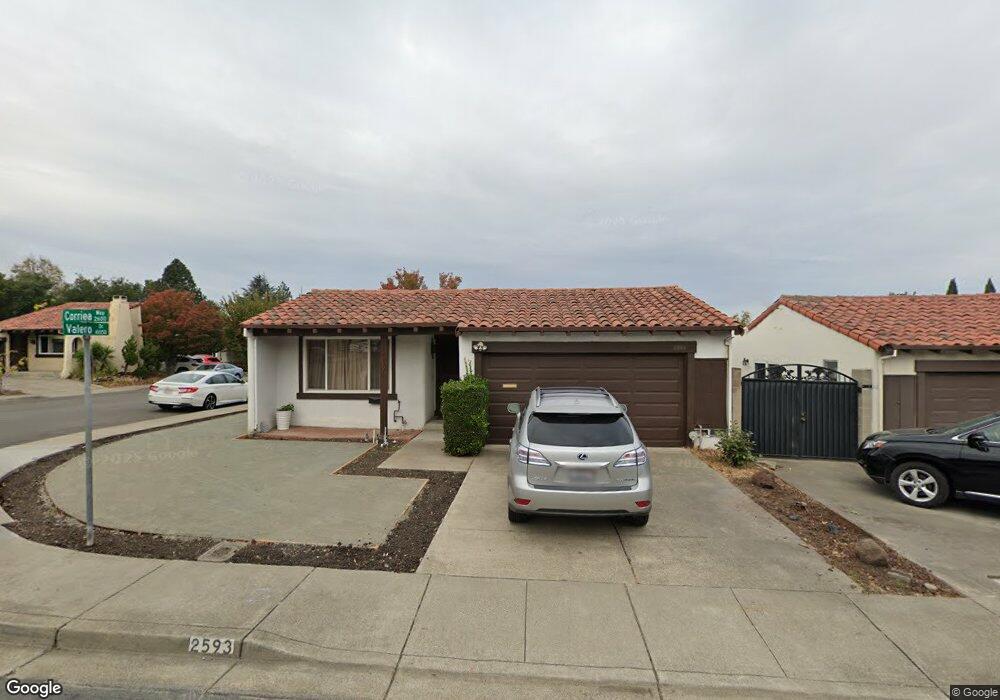
2593 Corriea Way Fremont, CA 94539
Kimber-Gomes NeighborhoodEstimated Value: $916,000 - $1,510,000
2
Beds
2
Baths
1,116
Sq Ft
$1,176/Sq Ft
Est. Value
About This Home
This home is located at 2593 Corriea Way, Fremont, CA 94539 and is currently estimated at $1,312,185, approximately $1,175 per square foot. 2593 Corriea Way is a home located in Alameda County with nearby schools including John Gomes Elementary School, William Hopkins Junior High School, and Mission San Jose High School.
Ownership History
Date
Name
Owned For
Owner Type
Purchase Details
Closed on
Feb 4, 2013
Sold by
Zheng Yuancheng and Gao Wei
Bought by
Zheng Yuancheng and Gao Wei
Current Estimated Value
Purchase Details
Closed on
Feb 3, 1999
Sold by
James Brian
Bought by
Zheng Yuan Cheng and Gao Wei
Home Financials for this Owner
Home Financials are based on the most recent Mortgage that was taken out on this home.
Original Mortgage
$223,200
Outstanding Balance
$50,034
Interest Rate
6.12%
Estimated Equity
$1,262,151
Purchase Details
Closed on
Oct 25, 1996
Sold by
Dillon Lawrence H
Bought by
James Brian
Home Financials for this Owner
Home Financials are based on the most recent Mortgage that was taken out on this home.
Original Mortgage
$3,216,280
Interest Rate
8.11%
Mortgage Type
Seller Take Back
Create a Home Valuation Report for This Property
The Home Valuation Report is an in-depth analysis detailing your home's value as well as a comparison with similar homes in the area
Home Values in the Area
Average Home Value in this Area
Purchase History
| Date | Buyer | Sale Price | Title Company |
|---|---|---|---|
| Zheng Yuancheng | -- | Fidelity National Title Comp | |
| Zheng Yuan Cheng | $248,000 | Chicago Title Co | |
| James Brian | $44,000 | Chicago Title Co |
Source: Public Records
Mortgage History
| Date | Status | Borrower | Loan Amount |
|---|---|---|---|
| Open | Zheng Yuan Cheng | $223,200 | |
| Previous Owner | James Brian | $3,216,280 |
Source: Public Records
Tax History Compared to Growth
Tax History
| Year | Tax Paid | Tax Assessment Tax Assessment Total Assessment is a certain percentage of the fair market value that is determined by local assessors to be the total taxable value of land and additions on the property. | Land | Improvement |
|---|---|---|---|---|
| 2025 | $5,144 | $388,768 | $116,630 | $272,138 |
| 2024 | $5,144 | $381,148 | $114,344 | $266,804 |
| 2023 | $4,995 | $373,675 | $112,102 | $261,573 |
| 2022 | $4,914 | $366,350 | $109,905 | $256,445 |
| 2021 | $4,799 | $359,167 | $107,750 | $251,417 |
| 2020 | $4,756 | $355,484 | $106,645 | $248,839 |
| 2019 | $4,705 | $348,516 | $104,555 | $243,961 |
| 2018 | $4,612 | $341,684 | $102,505 | $239,179 |
| 2017 | $4,498 | $334,985 | $100,495 | $234,490 |
| 2016 | $4,414 | $328,418 | $98,525 | $229,893 |
| 2015 | $4,347 | $323,485 | $97,045 | $226,440 |
| 2014 | $4,267 | $317,148 | $95,144 | $222,004 |
Source: Public Records
Map
Nearby Homes
- 2851 Finca Terrace
- 41043 Joyce Ave
- 1962 Briscoe Terrace
- 3331 Union St
- 41620 Beatrice St
- 41538 Casabella Common
- 40425 Chapel Way Unit 214
- 40425 Chapel Way Unit 309
- 41519 Apricot Ln
- 2785 Washington Blvd
- 1401 Lemos Ln
- 40769 Squill Common
- 40469 Shaw Ct
- 1123 Farragut Dr
- 40708 Fremont Blvd
- 2225 Valorie St
- 41212 Fremont Blvd
- 1224 Bedford St
- 3800 Adams Ave
- 42329 Troyer Ave
- 2573 Corriea Way
- 2592 Abaca Way
- 2582 Abaca Way
- 2553 Corriea Way
- 41050 Valero Dr
- 41041 Valero Dr
- 2572 Abaca Way
- 41031 Valero Dr
- 41051 Valero Dr
- 2533 Corriea Way
- 41021 Valero Dr
- 41059 Bairo Ct
- 41060 Valero Dr
- 41061 Valero Dr
- 2552 Abaca Way
- 41011 Valero Dr
- 41069 Bairo Ct
- 2513 Corriea Way
- 41071 Valero Dr
- 2532 Abaca Way