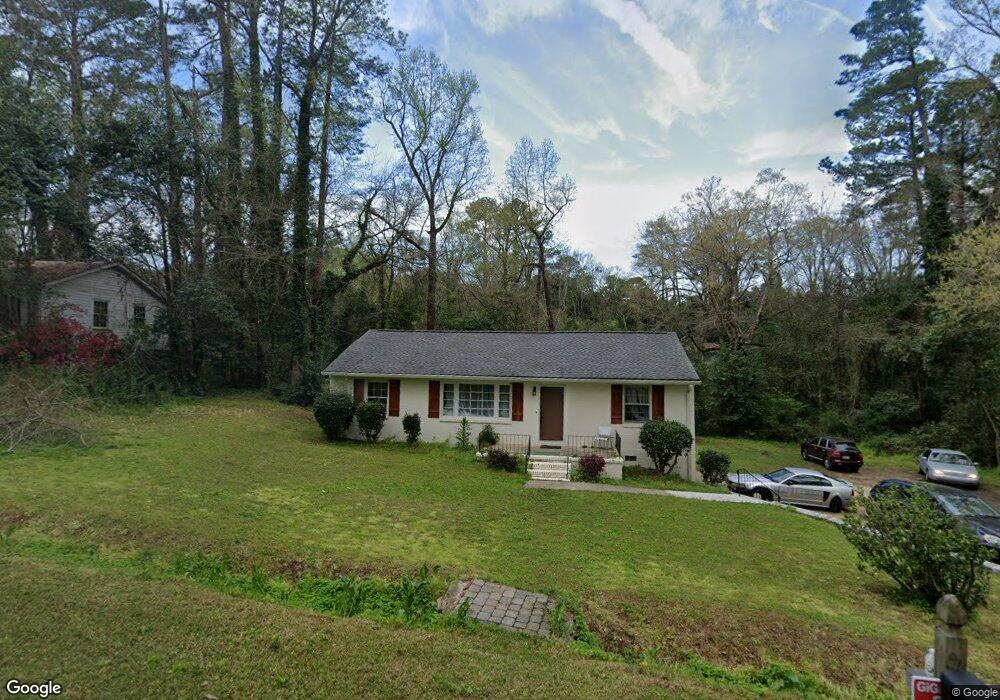
2593 N Nancelon Cir Unit 19 Macon, GA 31204
Estimated Value: $161,000 - $201,462
5
Beds
2
Baths
2,345
Sq Ft
$77/Sq Ft
Est. Value
About This Home
This home is located at 2593 N Nancelon Cir Unit 19, Macon, GA 31204 and is currently estimated at $180,616, approximately $77 per square foot. 2593 N Nancelon Cir Unit 19 is a home located in Bibb County with nearby schools including Rosa Taylor Elementary School, Miller Fine Arts Magnet Middle School, and Central High School.
Ownership History
Date
Name
Owned For
Owner Type
Purchase Details
Closed on
Jun 29, 2021
Sold by
Bauer Homes Llc
Bought by
2593 Nancelon Llc
Current Estimated Value
Purchase Details
Closed on
Sep 28, 2016
Bought by
Bauer Homes Llc
Purchase Details
Closed on
Apr 2, 2013
Sold by
Erikson Adam J and Erikson Kelly
Bought by
Capital City Bank
Purchase Details
Closed on
May 3, 2007
Sold by
J K Procurments & Cleaning Svs Inc
Bought by
Erikson Adam J and Erikson Kelley
Home Financials for this Owner
Home Financials are based on the most recent Mortgage that was taken out on this home.
Original Mortgage
$97,100
Interest Rate
6.1%
Mortgage Type
New Conventional
Purchase Details
Closed on
Apr 24, 2006
Sold by
Alliance Properties Group Llc
Bought by
J K Procurement & Cleanning Svs Inc
Purchase Details
Closed on
Feb 3, 2006
Sold by
Kirkman Jo Anne and Kirkman Sylvia S
Bought by
Alliance Property Group Llc
Create a Home Valuation Report for This Property
The Home Valuation Report is an in-depth analysis detailing your home's value as well as a comparison with similar homes in the area
Home Values in the Area
Average Home Value in this Area
Purchase History
| Date | Buyer | Sale Price | Title Company |
|---|---|---|---|
| 2593 Nancelon Llc | $120,000 | None Available | |
| Bauer Homes Llc | $35,000 | -- | |
| Capital City Bank | $60,000 | None Available | |
| Erikson Adam J | $101,000 | None Avilabale | |
| J K Procurement & Cleanning Svs Inc | $46,000 | None Available | |
| Alliance Property Group Llc | $35,000 | None Available |
Source: Public Records
Mortgage History
| Date | Status | Borrower | Loan Amount |
|---|---|---|---|
| Previous Owner | Erikson Adam J | $97,100 |
Source: Public Records
Tax History Compared to Growth
Tax History
| Year | Tax Paid | Tax Assessment Tax Assessment Total Assessment is a certain percentage of the fair market value that is determined by local assessors to be the total taxable value of land and additions on the property. | Land | Improvement |
|---|---|---|---|---|
| 2025 | $1,599 | $65,086 | $11,220 | $53,866 |
| 2024 | $1,553 | $61,146 | $11,220 | $49,926 |
| 2023 | $1,269 | $49,971 | $11,220 | $38,751 |
| 2022 | $1,659 | $47,906 | $10,442 | $37,464 |
| 2021 | $1,491 | $39,246 | $4,177 | $35,069 |
| 2020 | $1,222 | $31,479 | $3,342 | $28,137 |
| 2019 | $1,232 | $31,479 | $3,342 | $28,137 |
| 2018 | $2,176 | $33,301 | $5,164 | $28,137 |
| 2017 | $525 | $33,301 | $5,164 | $28,137 |
| 2016 | $983 | $28,399 | $5,164 | $23,234 |
| 2015 | $1,391 | $28,399 | $5,164 | $23,234 |
| 2014 | $592 | $31,521 | $7,291 | $24,230 |
Source: Public Records
Map
Nearby Homes
- 630 Pierce Ave
- 2576 Old Holton Rd
- 676 Pierce Ave
- 2659 Gwinnett Dr
- 720 Corbin Ave
- 2526 Old Holton Rd
- 2749 Northwoods Dr S
- 2471 Old Holton Rd
- 789 Pinewood Dr
- 2925 Malvern Hill Dr
- 509 Sugarloaf Dr
- 2939 General Lee Rd
- 2783 S Hillandale Cir
- 2956 Malvern Hill Dr
- 3175 Stinsonville Rd
- 2320 Kingsley Dr
- 2349 Berthadale Ave
- 946 Fair Oaks Dr
- 2593 N Nancelon Cir
- 2593 Nancelon Cir N Unit 19
- 2593 Nancelon Cir N
- 0 N Nancelon Cir
- N N Nancelon Cir
- 2594 Nancelon Cir S
- 2587 Nancelon Cir N
- 2573 Nancelon Cir N
- 2584 Nancelon Cir S
- 2566 Nancelon Cir N
- 2563 Nancelon Cir N
- 2574 Nancelon Cir S
- 2567 Nancelon Cir S
- 2558 N Pierce Cir
- 2542 N Pierce Cir
- 2558 Nancelon Cir N
- 772 Newton Place
- 2564 Nancelon Cir S
- 2525 Nancelon Cir N
- 2572 N Pierce Cir