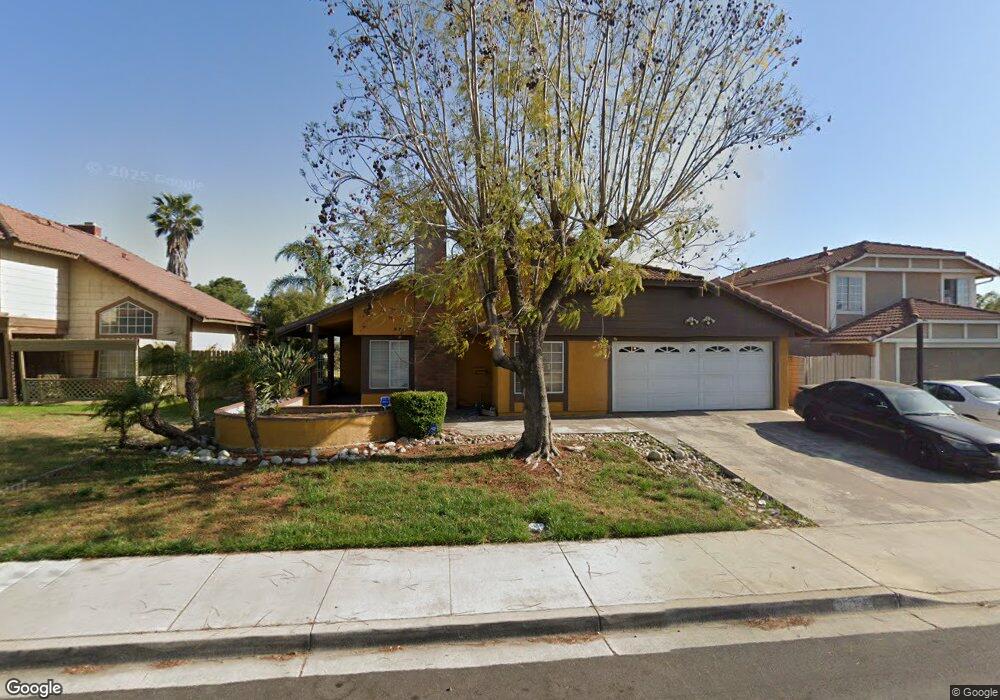
25949 Fir Ave Moreno Valley, CA 92553
Bear Valley NeighborhoodEstimated Value: $506,025 - $667,000
4
Beds
2
Baths
1,466
Sq Ft
$379/Sq Ft
Est. Value
About This Home
This home is located at 25949 Fir Ave, Moreno Valley, CA 92553 and is currently estimated at $555,006, approximately $378 per square foot. 25949 Fir Ave is a home located in Riverside County with nearby schools including Bear Valley Elementary School, Mountain View Middle, and Valley View High School.
Ownership History
Date
Name
Owned For
Owner Type
Purchase Details
Closed on
Jun 29, 2016
Sold by
Essley Sharonda Deshawn and Essley Sharonda Desawn
Bought by
Essley Sharonda Deshawn
Current Estimated Value
Purchase Details
Closed on
Nov 23, 2011
Sold by
Moore Gail D
Bought by
Essley Sharonda Desawn
Home Financials for this Owner
Home Financials are based on the most recent Mortgage that was taken out on this home.
Original Mortgage
$128,791
Outstanding Balance
$89,418
Interest Rate
4.4%
Mortgage Type
FHA
Estimated Equity
$465,588
Purchase Details
Closed on
Oct 10, 2000
Sold by
Case Tina E
Bought by
Moore Gail D
Home Financials for this Owner
Home Financials are based on the most recent Mortgage that was taken out on this home.
Original Mortgage
$136,871
Interest Rate
7.96%
Mortgage Type
FHA
Purchase Details
Closed on
Jan 30, 1997
Sold by
Charter Dana G
Bought by
Case Tina Elaine
Purchase Details
Closed on
Apr 26, 1996
Sold by
Dusold Martin C and Dusold Donna Lorraine
Bought by
Dusold Martin C and Dosuld Donna L
Create a Home Valuation Report for This Property
The Home Valuation Report is an in-depth analysis detailing your home's value as well as a comparison with similar homes in the area
Home Values in the Area
Average Home Value in this Area
Purchase History
| Date | Buyer | Sale Price | Title Company |
|---|---|---|---|
| Essley Sharonda Deshawn | -- | Wfg National Title Co Of Ca | |
| Essley Sharonda Desawn | $130,000 | Chicago Title | |
| Moore Gail D | $138,000 | Commonwealth Land Title Co | |
| Case Tina Elaine | -- | -- | |
| Dusold Martin C | -- | -- |
Source: Public Records
Mortgage History
| Date | Status | Borrower | Loan Amount |
|---|---|---|---|
| Open | Essley Sharonda Desawn | $128,791 | |
| Previous Owner | Moore Gail D | $136,871 |
Source: Public Records
Tax History Compared to Growth
Tax History
| Year | Tax Paid | Tax Assessment Tax Assessment Total Assessment is a certain percentage of the fair market value that is determined by local assessors to be the total taxable value of land and additions on the property. | Land | Improvement |
|---|---|---|---|---|
| 2025 | $1,862 | $163,273 | $37,675 | $125,598 |
| 2023 | $1,862 | $156,935 | $36,213 | $120,722 |
| 2022 | $1,791 | $153,858 | $35,503 | $118,355 |
| 2021 | $1,758 | $150,842 | $34,807 | $116,035 |
| 2020 | $1,777 | $149,297 | $34,451 | $114,846 |
| 2019 | $1,710 | $146,371 | $33,776 | $112,595 |
| 2018 | $1,676 | $143,502 | $33,114 | $110,388 |
| 2017 | $1,640 | $140,689 | $32,465 | $108,224 |
| 2016 | $1,622 | $137,931 | $31,829 | $106,102 |
| 2015 | $1,599 | $135,860 | $31,351 | $104,509 |
| 2014 | $1,492 | $133,201 | $30,738 | $102,463 |
Source: Public Records
Map
Nearby Homes
- 12566 Lasselle St
- 12638 Juneberry Ct
- 26110 Primrose Way
- 26118 Biloxi Dr
- 12789 Raenette Way
- 26300 Le Mans Dr
- 13060 Pawnee Dr
- 12627 Dogwood Way
- 12601 Heartleaf St
- 13064 Bender Dr
- 12655 Kitching St
- 12331 Grenville Ave
- 26500 Coconut Ln
- 12940 Shawnee St
- 24384 Fir Ave
- 24320 Fir Ave
- 12613 Torrey Pine Rd
- 12124 Champlain St
- 12771 Foreman Ave
- 12120 Palm Vista St
- 25937 Fir Ave
- 25961 Fir Ave
- 25950 Deerberry Dr
- 25925 Fir Ave
- 25973 Fir Ave
- 25962 Deerberry Dr
- 25926 Deerberry Dr
- 25944 Fir Ave
- 25958 Fir Ave
- 25985 Fir Ave
- 25913 Fir Ave
- 25972 Fir Ave
- 25930 Fir Ave
- 25914 Deerberry Dr
- 12822 Winterberry Way
- 12791 Lasselle St
- 25986 Fir Ave
- 25997 Fir Ave
- 25916 Fir Ave
- 25901 Fir Ave