
$196,950
- 3 Beds
- 2 Baths
- 1,404 Sq Ft
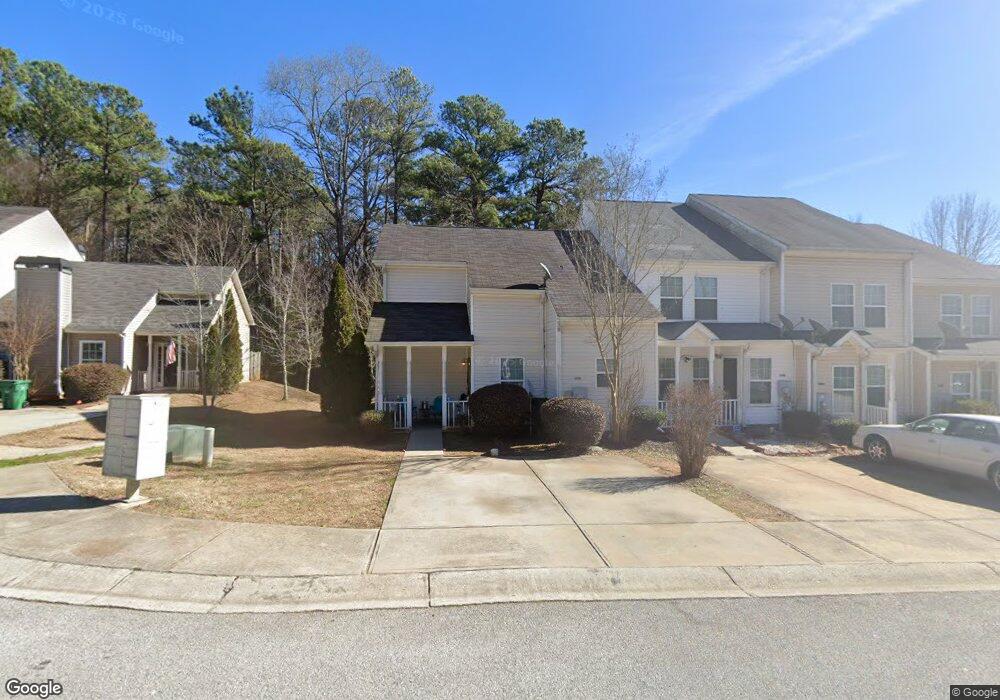
- 5902 Trent Walk Dr
- Lithonia, GA
Very nice Affordable townhome in Lithonia/Stonecrest! Currently leased to a long-term resident. Don't miss out on this opportunity for an investor or owner-occupant buyer. no rental restrictions and low HOA dues, 275 annually. This 3-bedroom townhome feature your master on main floor, nice fireplace in family room. It has a door wall that open up to wonderful patio. Also, there is an open covered
Ransom Chandler Marcellus & Associates