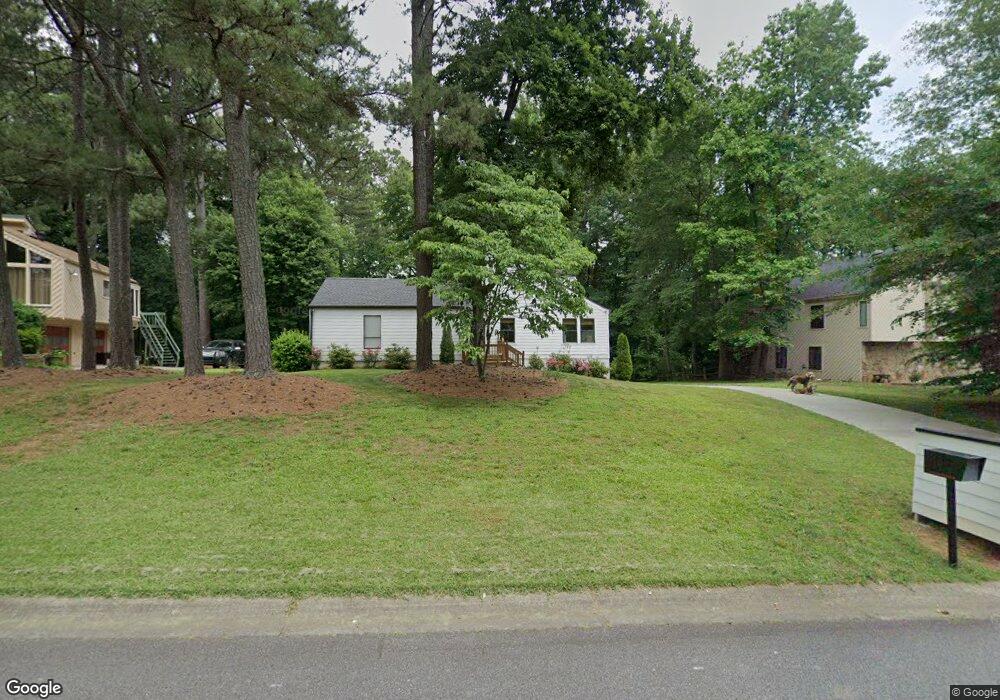
2598 Ballew Ct NE Unit 15 Marietta, GA 30062
East Cobb NeighborhoodEstimated Value: $495,000 - $522,000
3
Beds
2
Baths
2,416
Sq Ft
$211/Sq Ft
Est. Value
About This Home
This home is located at 2598 Ballew Ct NE Unit 15, Marietta, GA 30062 and is currently estimated at $508,592, approximately $210 per square foot. 2598 Ballew Ct NE Unit 15 is a home located in Cobb County with nearby schools including Mountain View Elementary School, Hightower Trail Middle School, and Pope High School.
Ownership History
Date
Name
Owned For
Owner Type
Purchase Details
Closed on
May 23, 2019
Sold by
Ch Hm Svcs Inc
Bought by
Preston Andrew
Current Estimated Value
Home Financials for this Owner
Home Financials are based on the most recent Mortgage that was taken out on this home.
Original Mortgage
$263,200
Outstanding Balance
$231,406
Interest Rate
4.2%
Mortgage Type
New Conventional
Estimated Equity
$277,186
Purchase Details
Closed on
Dec 13, 2017
Sold by
Wilmington Saving Fund Soc
Bought by
Ch Hm Svcs Inc
Purchase Details
Closed on
May 2, 2017
Sold by
Evans David H
Bought by
Wilmington Saving Fund Society
Purchase Details
Closed on
Jan 25, 1994
Sold by
Achord Lewis W Lynette M
Bought by
Evans David H
Home Financials for this Owner
Home Financials are based on the most recent Mortgage that was taken out on this home.
Original Mortgage
$102,691
Interest Rate
7.1%
Mortgage Type
FHA
Create a Home Valuation Report for This Property
The Home Valuation Report is an in-depth analysis detailing your home's value as well as a comparison with similar homes in the area
Home Values in the Area
Average Home Value in this Area
Purchase History
| Date | Buyer | Sale Price | Title Company |
|---|---|---|---|
| Preston Andrew | $329,000 | -- | |
| Ch Hm Svcs Inc | $199,910 | -- | |
| Wilmington Saving Fund Society | -- | -- | |
| Evans David H | $102,000 | -- |
Source: Public Records
Mortgage History
| Date | Status | Borrower | Loan Amount |
|---|---|---|---|
| Open | Preston Andrew | $263,200 | |
| Previous Owner | Evans David H | $102,691 |
Source: Public Records
Tax History Compared to Growth
Tax History
| Year | Tax Paid | Tax Assessment Tax Assessment Total Assessment is a certain percentage of the fair market value that is determined by local assessors to be the total taxable value of land and additions on the property. | Land | Improvement |
|---|---|---|---|---|
| 2025 | $4,373 | $168,784 | $52,000 | $116,784 |
| 2024 | $4,170 | $159,252 | $40,000 | $119,252 |
| 2023 | $3,620 | $158,932 | $28,000 | $130,932 |
| 2022 | $4,193 | $158,932 | $28,000 | $130,932 |
| 2021 | $3,544 | $129,292 | $28,000 | $101,292 |
| 2020 | $3,542 | $116,696 | $28,000 | $88,696 |
| 2019 | $3,542 | $116,696 | $28,000 | $88,696 |
| 2018 | $2,427 | $79,960 | $21,400 | $58,560 |
| 2017 | $2,005 | $88,080 | $23,600 | $64,480 |
| 2016 | $1,858 | $81,192 | $22,000 | $59,192 |
| 2015 | $1,773 | $75,708 | $19,000 | $56,708 |
| 2014 | $1,785 | $75,708 | $0 | $0 |
Source: Public Records
Map
Nearby Homes
- 2260 Falkirk Pointe Dr
- 2607 Lulworth Ln
- 2864 Saint Andrews Way NE
- 3091 Branford Ct
- 2998 Kodiak Ct
- 2726 Riderwood Ln NE
- 2919 Manitoba Ln
- 3237 Harvest Way
- 2735 Wendy Ln
- 2853 Wendwood Dr
- 2963 Timberline Rd Unit 2
- 3287 Harvest Way
- 3006 Alberta Dr
- 2934 Wendover St
- 3297 Post Oak Tritt Rd
- 3152 Normandy Cir NE
- 2138 Cedar Forks Dr Unit 2
- 2598 Ballew Ct NE
- 2592 Ballew Ct NE
- 2602 Ballew Ct NE
- 2584 Ballew Ct NE
- 2606 Ballew Ct NE
- 2597 Spencers Trace NE
- 2591 Spencers Trace NE
- 2613 Spencers Trace NE
- 2599 Ballew Ct NE
- 2605 Spencers Trace NE
- 2595 Ballew Ct NE
- 2585 Spencers Trace NE
- 2619 Spencers Trace NE
- 2603 Ballew Ct NE
- 2610 Ballew Ct NE
- 2591 Ballew Ct NE
- 2625 Spencers Trace NE
- 2579 Spencers Trace NE
- 2587 Ballew Ct NE
- 263 Spencers Trace NE