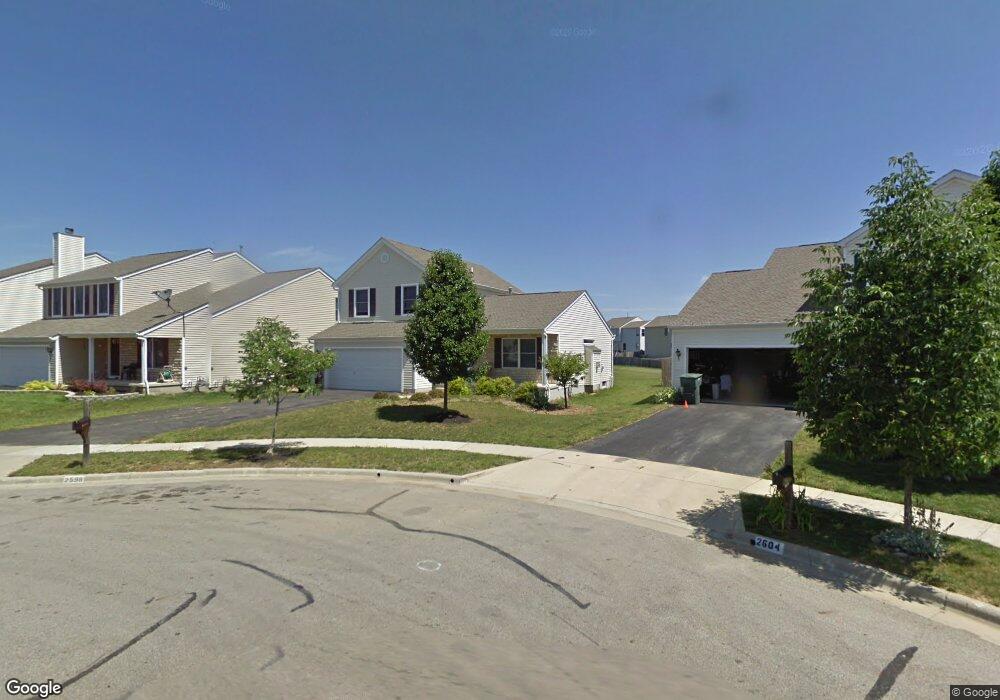
2598 Weeping Willow Ct Unit 159 Columbus, OH 43207
Williams Creek NeighborhoodEstimated Value: $279,000 - $325,000
3
Beds
3
Baths
1,578
Sq Ft
$190/Sq Ft
Est. Value
About This Home
This home is located at 2598 Weeping Willow Ct Unit 159, Columbus, OH 43207 and is currently estimated at $300,427, approximately $190 per square foot. 2598 Weeping Willow Ct Unit 159 is a home located in Franklin County with nearby schools including Groveport Madison High School, South Columbus Preparatory Academy at Southfield, and South Scioto Academy.
Ownership History
Date
Name
Owned For
Owner Type
Purchase Details
Closed on
Jan 28, 2022
Sold by
Chris Smart
Bought by
Bauccio Anthony Michael and Bluhm Tasha C
Current Estimated Value
Home Financials for this Owner
Home Financials are based on the most recent Mortgage that was taken out on this home.
Original Mortgage
$247,000
Outstanding Balance
$229,079
Interest Rate
3.45%
Mortgage Type
New Conventional
Estimated Equity
$71,348
Purchase Details
Closed on
Jan 3, 2021
Sold by
Cripe Thomas E and Cripe Celeste
Bought by
Smart Chris and Cripe Thomas E
Purchase Details
Closed on
Mar 21, 2005
Sold by
Dominion Homes Inc
Bought by
Cripe Thomas E
Home Financials for this Owner
Home Financials are based on the most recent Mortgage that was taken out on this home.
Original Mortgage
$135,760
Interest Rate
5%
Mortgage Type
Purchase Money Mortgage
Create a Home Valuation Report for This Property
The Home Valuation Report is an in-depth analysis detailing your home's value as well as a comparison with similar homes in the area
Home Values in the Area
Average Home Value in this Area
Purchase History
| Date | Buyer | Sale Price | Title Company |
|---|---|---|---|
| Bauccio Anthony Michael | $266,000 | Chase Title & Escrow Services | |
| Smart Chris | $74,800 | Chase Title & Escrow Services | |
| Cripe Thomas E | $169,700 | Alliance Ti |
Source: Public Records
Mortgage History
| Date | Status | Borrower | Loan Amount |
|---|---|---|---|
| Open | Bauccio Anthony Michael | $247,000 | |
| Previous Owner | Cripe Thomas E | $135,760 | |
| Closed | Cripe Thomas E | $33,940 |
Source: Public Records
Tax History Compared to Growth
Tax History
| Year | Tax Paid | Tax Assessment Tax Assessment Total Assessment is a certain percentage of the fair market value that is determined by local assessors to be the total taxable value of land and additions on the property. | Land | Improvement |
|---|---|---|---|---|
| 2024 | $3,711 | $87,510 | $22,930 | $64,580 |
| 2023 | $3,675 | $87,500 | $22,925 | $64,575 |
| 2022 | $2,644 | $52,360 | $8,400 | $43,960 |
| 2021 | $2,652 | $52,360 | $8,400 | $43,960 |
| 2020 | $2,656 | $52,360 | $8,400 | $43,960 |
| 2019 | $2,579 | $45,470 | $7,000 | $38,470 |
| 2018 | $2,625 | $45,470 | $7,000 | $38,470 |
| 2017 | $2,615 | $45,470 | $7,000 | $38,470 |
| 2016 | $2,627 | $41,940 | $7,530 | $34,410 |
| 2015 | $2,656 | $41,940 | $7,530 | $34,410 |
| 2014 | $2,686 | $41,940 | $7,530 | $34,410 |
| 2013 | $1,323 | $49,350 | $8,855 | $40,495 |
Source: Public Records
Map
Nearby Homes
- 3865 Pendent Ln
- 2587 Winningwillow Dr
- 3622 Pendent Ln
- 3724 Revolutionary Dr Unit 111
- 2585 Millview Dr
- 2629 Patrick Henry Ave Unit 40
- 0 Alum Creek Dr Unit 225007823
- 2318 Rodger Rd
- 2229 Maureen Blvd N
- 2222 Maureen Blvd S
- 2681 Meigs Dr
- 2685 Meigs Dr
- 2689 Meigs Dr
- 2693 Meigs Dr
- 2697 Meigs Dr
- 3242 Mackinac Dr
- 2670 Meigs Dr
- 2674 Meigs Dr
- 2682 Meigs Dr
- 2686 Meigs Dr
- 2598 Weeping Willow Ct
- 2592 Weeping Willow Ct
- 2604 Weeping Willow Ct
- 2586 Weeping Willow Ct
- 2610 Weeping Willow Ct
- 2580 Weeping Willow Ct
- 3835 Pendent Ln
- 3829 Pendent Ln
- 2574 Weeping Willow Ct
- 2616 Weeping Willow Ct
- 2581 Weeping Willow Ct
- 2593 Weeping Willow Ct
- 3841 Pendent Ln
- 3823 Pendent Ln
- 2575 Weeping Willow Ct
- 2599 Weeping Willow Ct
- 2568 Weeping Willow Ct
- 3817 Pendent Ln
- 2569 Weeping Willow Ct
- 3847 Pendent Ln