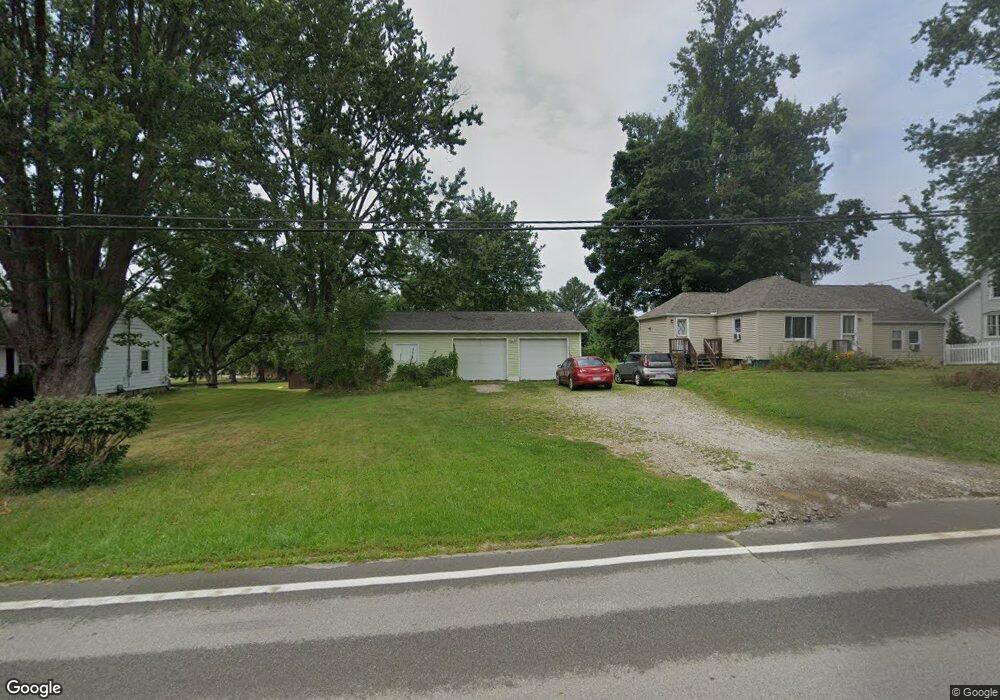
2599 Columbus Rd Wooster, OH 44691
Estimated Value: $210,682 - $237,000
3
Beds
1
Bath
1,368
Sq Ft
$165/Sq Ft
Est. Value
About This Home
This home is located at 2599 Columbus Rd, Wooster, OH 44691 and is currently estimated at $225,921, approximately $165 per square foot. 2599 Columbus Rd is a home located in Wayne County with nearby schools including Triway High School, St. Mary of Immaculate Conception School, and Country Corner.
Ownership History
Date
Name
Owned For
Owner Type
Purchase Details
Closed on
Dec 20, 2007
Sold by
Frontz Richard E and Frontz Patricia C
Bought by
Jones Shannon M
Current Estimated Value
Home Financials for this Owner
Home Financials are based on the most recent Mortgage that was taken out on this home.
Original Mortgage
$89,000
Outstanding Balance
$62,625
Interest Rate
6.31%
Mortgage Type
USDA
Estimated Equity
$163,296
Purchase Details
Closed on
Apr 24, 2006
Sold by
Miles D Richard and Heilman Cara D
Bought by
Frontz Richard E and Frontz Patricia C
Purchase Details
Closed on
Mar 24, 2005
Sold by
Collier Johnny K
Bought by
Lisle Cara D and Heilman Cara D
Purchase Details
Closed on
Jul 28, 1995
Sold by
Shadley Kay E
Bought by
Miles D R
Purchase Details
Closed on
Mar 10, 1992
Sold by
Shadley James C and Shadley Kay E
Bought by
Shadley Kay E
Create a Home Valuation Report for This Property
The Home Valuation Report is an in-depth analysis detailing your home's value as well as a comparison with similar homes in the area
Home Values in the Area
Average Home Value in this Area
Purchase History
| Date | Buyer | Sale Price | Title Company |
|---|---|---|---|
| Jones Shannon M | $86,000 | Attorney | |
| Frontz Richard E | $85,500 | None Available | |
| Lisle Cara D | -- | -- | |
| Miles D R | $79,000 | -- | |
| Shadley Kay E | -- | -- |
Source: Public Records
Mortgage History
| Date | Status | Borrower | Loan Amount |
|---|---|---|---|
| Open | Jones Shannon M | $89,000 |
Source: Public Records
Tax History Compared to Growth
Tax History
| Year | Tax Paid | Tax Assessment Tax Assessment Total Assessment is a certain percentage of the fair market value that is determined by local assessors to be the total taxable value of land and additions on the property. | Land | Improvement |
|---|---|---|---|---|
| 2024 | $1,923 | $52,460 | $13,870 | $38,590 |
| 2023 | $1,923 | $52,930 | $13,870 | $39,060 |
| 2022 | $1,604 | $39,500 | $10,350 | $29,150 |
| 2021 | $1,498 | $39,500 | $10,350 | $29,150 |
| 2020 | $1,516 | $39,500 | $10,350 | $29,150 |
| 2019 | $1,196 | $30,020 | $8,970 | $21,050 |
| 2018 | $1,218 | $30,020 | $8,970 | $21,050 |
| 2017 | $1,185 | $30,020 | $8,970 | $21,050 |
| 2016 | $1,185 | $29,010 | $8,970 | $20,040 |
| 2015 | $1,158 | $29,010 | $8,970 | $20,040 |
| 2014 | $1,159 | $29,010 | $8,970 | $20,040 |
| 2013 | $1,174 | $28,140 | $8,840 | $19,300 |
Source: Public Records
Map
Nearby Homes
- 2430 S Columbus Rd
- 2560 Rutt Ct
- 0 Batdorf Rd
- 0 Blachleyville Rd
- 3532 Triway Ln
- 1131 Curtwood Dr
- 2844 Morning Hill Dr
- 1970 Batdorf Rd
- 3979 Batdorf Rd
- 3940 Batdorf Rd
- 0 Heyl Rd
- 1740 Barnes Dr
- 1174 Columbus Rd
- 349 W North St
- 5001 S Jefferson Rd
- 323 N Grant St
- 229 N Walnut St
- 227 N Walnut St
- 450 N Grant St
- 537 N Grant St
- 2613 Columbus Rd
- 2589 Columbus Rd
- 2627 Columbus Rd
- 2648 Graceland Way
- 2622 Graceland Way
- 2610 Columbus Rd
- 2637 Columbus Rd
- 2578 Columbus Rd
- 2602 Graceland Way
- 2565 Columbus Rd
- 2647 Graceland Way
- 2671 Graceland Way
- 2580 Graceland Way
- 2623 Graceland Way
- 2655 Columbus Rd
- 2693 Graceland Way
- 2543 Columbus Rd
- 2601 Graceland Way
- 2667 Columbus Rd
- 2579 Graceland Way