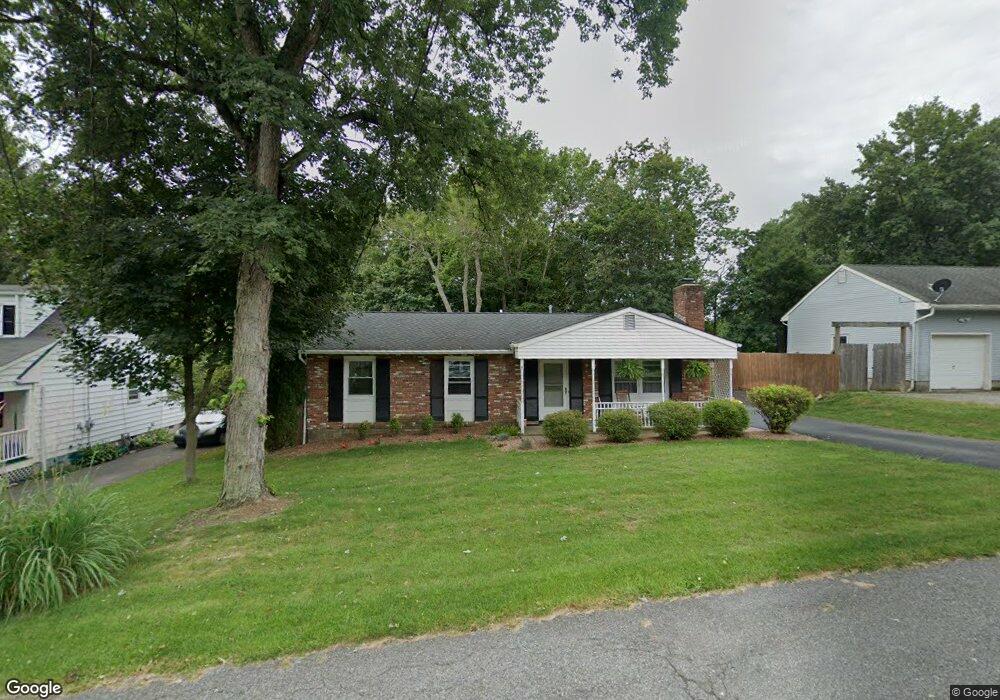
25A Sylvan Rd High Bridge, NJ 08829
Estimated Value: $418,891 - $466,000
Studio
--
Bath
1,452
Sq Ft
$305/Sq Ft
Est. Value
About This Home
This home is located at 25A Sylvan Rd, High Bridge, NJ 08829 and is currently estimated at $442,473, approximately $304 per square foot. 25A Sylvan Rd is a home located in Hunterdon County with nearby schools including High Bridge Elementary School, High Bridge Middle School, and Voorhees High School.
Ownership History
Date
Name
Owned For
Owner Type
Purchase Details
Closed on
Oct 31, 2006
Sold by
Biegel John and Biegel Diane
Bought by
Mulry Patrick and Mulry Karin
Current Estimated Value
Home Financials for this Owner
Home Financials are based on the most recent Mortgage that was taken out on this home.
Original Mortgage
$251,300
Outstanding Balance
$150,809
Interest Rate
6.47%
Mortgage Type
Purchase Money Mortgage
Estimated Equity
$291,664
Purchase Details
Closed on
Sep 29, 1995
Sold by
Sekula Bernard C and Sekula Donna Marie
Bought by
Biegel John and Biegel Diane
Create a Home Valuation Report for This Property
The Home Valuation Report is an in-depth analysis detailing your home's value as well as a comparison with similar homes in the area
Home Values in the Area
Average Home Value in this Area
Purchase History
| Date | Buyer | Sale Price | Title Company |
|---|---|---|---|
| Mulry Patrick | $314,150 | None Available | |
| Biegel John | $142,000 | -- |
Source: Public Records
Mortgage History
| Date | Status | Borrower | Loan Amount |
|---|---|---|---|
| Open | Mulry Patrick | $251,300 |
Source: Public Records
Tax History
| Year | Tax Paid | Tax Assessment Tax Assessment Total Assessment is a certain percentage of the fair market value that is determined by local assessors to be the total taxable value of land and additions on the property. | Land | Improvement |
|---|---|---|---|---|
| 2025 | $11,662 | $307,300 | $182,000 | $125,300 |
| 2024 | $10,533 | $357,300 | $143,600 | $213,700 |
| 2023 | $10,533 | $266,400 | $107,900 | $158,500 |
| 2022 | $9,148 | $215,000 | $95,100 | $119,900 |
| 2021 | $8,989 | $215,300 | $95,100 | $120,200 |
| 2020 | $8,860 | $216,100 | $95,100 | $121,000 |
| 2019 | $8,960 | $216,900 | $95,100 | $121,800 |
| 2018 | $8,520 | $215,000 | $92,500 | $122,500 |
| 2017 | $8,602 | $223,200 | $102,000 | $121,200 |
| 2016 | $8,502 | $223,200 | $102,000 | $121,200 |
| 2015 | $8,272 | $223,200 | $102,000 | $121,200 |
| 2014 | $8,264 | $241,000 | $137,700 | $103,300 |
Source: Public Records
Map
Nearby Homes
Your Personal Tour Guide
Ask me questions while you tour the home.