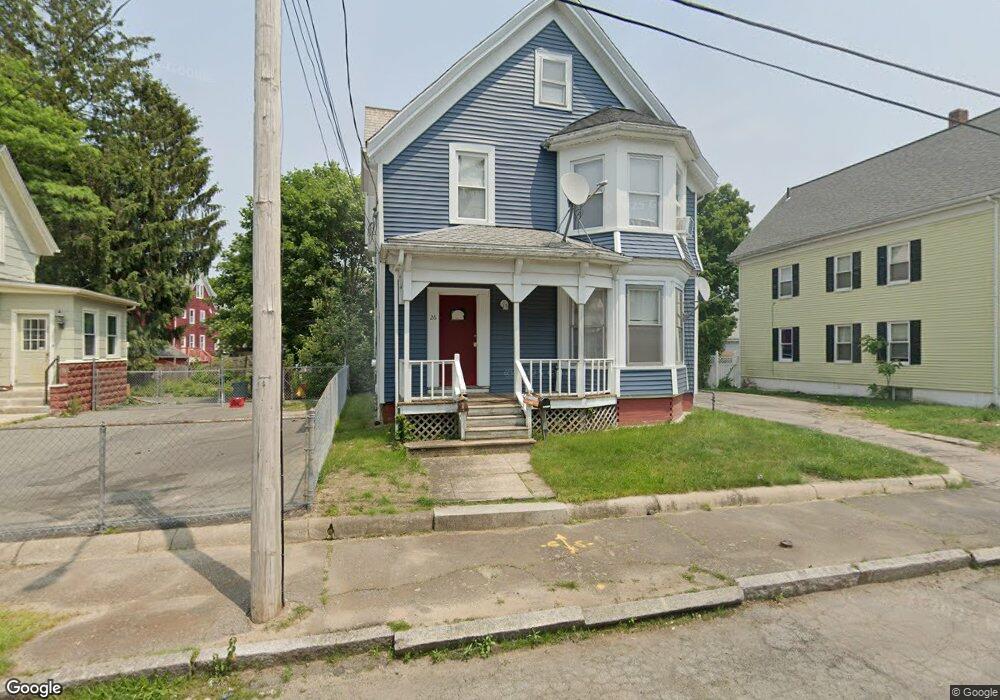
26 3rd St Brockton, MA 02301
Clifton Heights NeighborhoodEstimated Value: $585,525 - $847,000
4
Beds
2
Baths
2,442
Sq Ft
$292/Sq Ft
Est. Value
About This Home
This home is located at 26 3rd St, Brockton, MA 02301 and is currently estimated at $712,881, approximately $291 per square foot. 26 3rd St is a home located in Plymouth County with nearby schools including Gilmore Elementary School, John F. Kennedy Elementary School, and Davis K-8 School.
Ownership History
Date
Name
Owned For
Owner Type
Purchase Details
Closed on
Jun 17, 2011
Sold by
Rodrigues Jose
Bought by
J-Rod Llc
Current Estimated Value
Purchase Details
Closed on
Sep 28, 1992
Sold by
Hinrichs Fred V Est
Bought by
Rodrigues Jose A and Rodrigues Irlando
Home Financials for this Owner
Home Financials are based on the most recent Mortgage that was taken out on this home.
Original Mortgage
$73,500
Interest Rate
7.9%
Mortgage Type
Purchase Money Mortgage
Create a Home Valuation Report for This Property
The Home Valuation Report is an in-depth analysis detailing your home's value as well as a comparison with similar homes in the area
Home Values in the Area
Average Home Value in this Area
Purchase History
| Date | Buyer | Sale Price | Title Company |
|---|---|---|---|
| J-Rod Llc | -- | -- | |
| Rodrigues Jose A | $80,000 | -- |
Source: Public Records
Mortgage History
| Date | Status | Borrower | Loan Amount |
|---|---|---|---|
| Previous Owner | Rodrigues Jose A | $70,000 | |
| Previous Owner | Rodrigues Jose A | $73,500 |
Source: Public Records
Tax History
| Year | Tax Paid | Tax Assessment Tax Assessment Total Assessment is a certain percentage of the fair market value that is determined by local assessors to be the total taxable value of land and additions on the property. | Land | Improvement |
|---|---|---|---|---|
| 2025 | $5,648 | $466,400 | $137,200 | $329,200 |
| 2024 | $6,772 | $563,400 | $137,200 | $426,200 |
| 2023 | $5,454 | $420,200 | $102,500 | $317,700 |
| 2022 | $5,964 | $426,900 | $93,000 | $333,900 |
| 2021 | $5,366 | $370,100 | $77,000 | $293,100 |
| 2020 | $5,072 | $334,800 | $72,500 | $262,300 |
| 2019 | $5,046 | $324,700 | $70,200 | $254,500 |
| 2018 | $4,648 | $289,400 | $70,200 | $219,200 |
| 2017 | $4,336 | $269,300 | $70,200 | $199,100 |
| 2016 | $4,335 | $249,700 | $68,000 | $181,700 |
| 2015 | $3,374 | $185,900 | $68,000 | $117,900 |
| 2014 | $3,350 | $184,800 | $68,000 | $116,800 |
Source: Public Records
Map
Nearby Homes
Your Personal Tour Guide
Ask me questions while you tour the home.