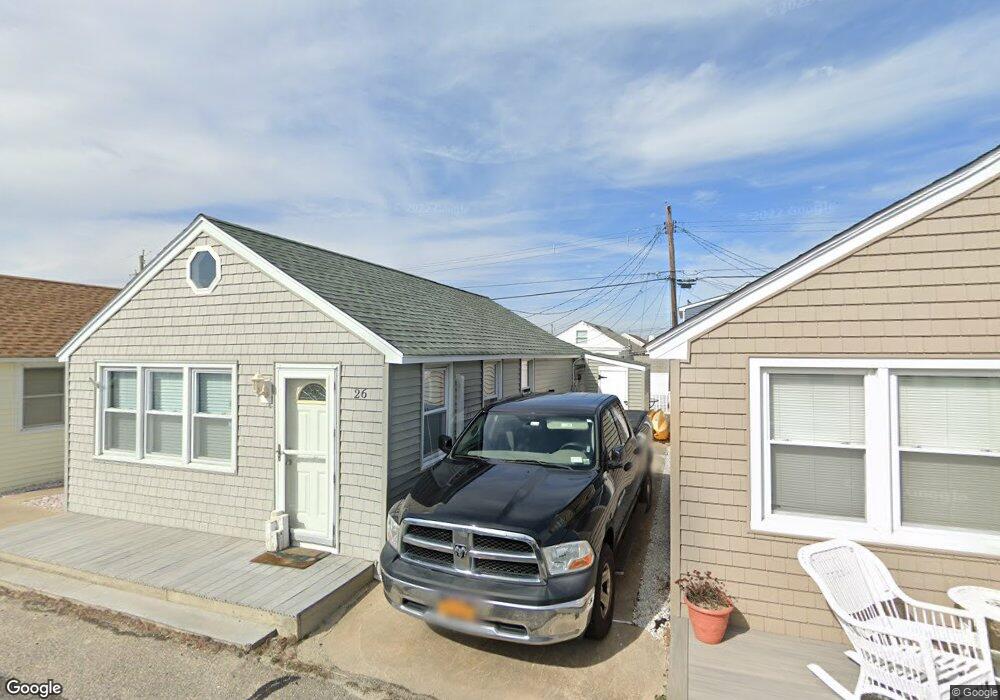
26 9th Ln Seaside Park, NJ 08752
Estimated Value: $557,092 - $634,000
2
Beds
1
Bath
576
Sq Ft
$1,021/Sq Ft
Est. Value
About This Home
This home is located at 26 9th Ln, Seaside Park, NJ 08752 and is currently estimated at $588,023, approximately $1,020 per square foot. 26 9th Ln is a home located in Ocean County with nearby schools including Central Regional Middle School and Central Regional High School.
Ownership History
Date
Name
Owned For
Owner Type
Purchase Details
Closed on
Sep 17, 2024
Sold by
Muldoon Robert and Muldoon Carol
Bought by
Robert And Carol Muldoon Joint Revocable Trus and Muldoon
Current Estimated Value
Purchase Details
Closed on
Apr 20, 2005
Sold by
Olivo Charles and Olivo Frances
Bought by
Muldoon Robert and Muldoon Carol
Home Financials for this Owner
Home Financials are based on the most recent Mortgage that was taken out on this home.
Original Mortgage
$308,000
Interest Rate
5.95%
Mortgage Type
Fannie Mae Freddie Mac
Create a Home Valuation Report for This Property
The Home Valuation Report is an in-depth analysis detailing your home's value as well as a comparison with similar homes in the area
Home Values in the Area
Average Home Value in this Area
Purchase History
| Date | Buyer | Sale Price | Title Company |
|---|---|---|---|
| Robert And Carol Muldoon Joint Revocable Trus | -- | None Listed On Document | |
| Robert And Carol Muldoon Joint Revocable Trus | -- | None Listed On Document | |
| Robert And Carol Muldoon Joint Revocable Trus | -- | None Listed On Document | |
| Muldoon Robert | $385,000 | First American Title Ins Co |
Source: Public Records
Mortgage History
| Date | Status | Borrower | Loan Amount |
|---|---|---|---|
| Previous Owner | Muldoon Robert | $308,000 |
Source: Public Records
Tax History Compared to Growth
Tax History
| Year | Tax Paid | Tax Assessment Tax Assessment Total Assessment is a certain percentage of the fair market value that is determined by local assessors to be the total taxable value of land and additions on the property. | Land | Improvement |
|---|---|---|---|---|
| 2025 | $8,041 | $333,500 | $273,000 | $60,500 |
| 2024 | $7,737 | $333,500 | $273,000 | $60,500 |
| 2023 | $7,594 | $333,500 | $273,000 | $60,500 |
| 2022 | $7,594 | $333,500 | $273,000 | $60,500 |
| 2021 | $7,434 | $333,500 | $273,000 | $60,500 |
| 2020 | $7,434 | $333,500 | $273,000 | $60,500 |
| 2019 | $7,227 | $333,500 | $273,000 | $60,500 |
| 2018 | $7,204 | $333,500 | $273,000 | $60,500 |
| 2017 | $6,700 | $322,100 | $273,000 | $49,100 |
| 2016 | $6,664 | $322,100 | $273,000 | $49,100 |
| 2015 | $6,481 | $322,100 | $273,000 | $49,100 |
| 2014 | $6,297 | $322,100 | $273,000 | $49,100 |
Source: Public Records
Map
Nearby Homes