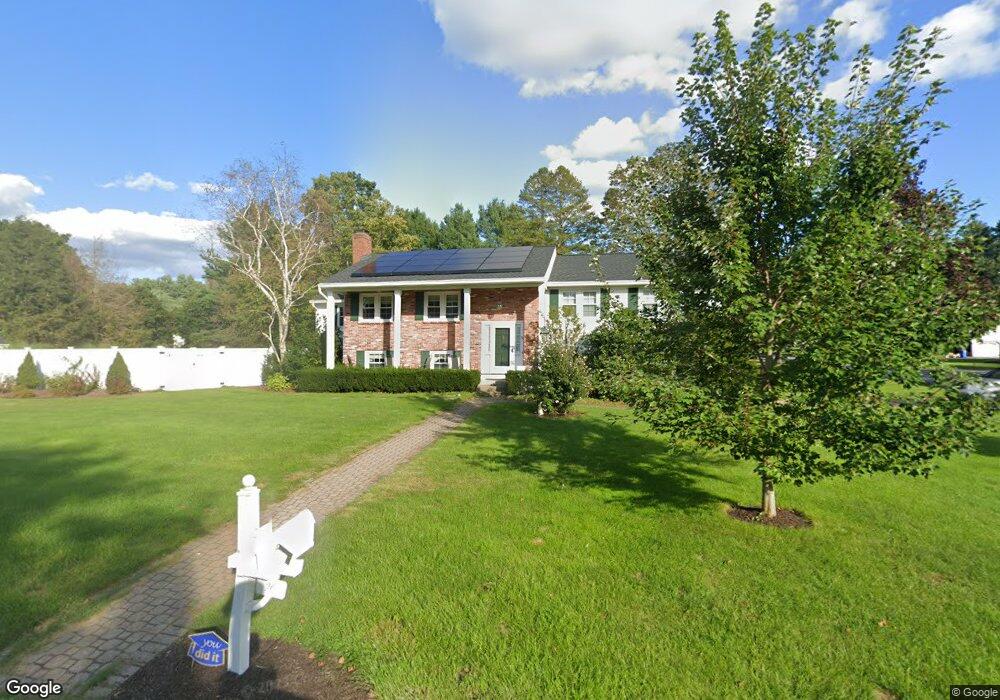
26 Abbot Bridge Dr Andover, MA 01810
Southern Andover NeighborhoodEstimated Value: $1,033,080 - $1,296,000
3
Beds
3
Baths
2,406
Sq Ft
$482/Sq Ft
Est. Value
About This Home
This home is located at 26 Abbot Bridge Dr, Andover, MA 01810 and is currently estimated at $1,160,020, approximately $482 per square foot. 26 Abbot Bridge Dr is a home located in Essex County with nearby schools including South Elementary School, Doherty Middle School, and Andover High School.
Ownership History
Date
Name
Owned For
Owner Type
Purchase Details
Closed on
Nov 15, 2007
Sold by
Elaine M Diodato T M and Elaine Diodati
Bought by
Rees Christine M and Rees Malcolm C
Current Estimated Value
Home Financials for this Owner
Home Financials are based on the most recent Mortgage that was taken out on this home.
Original Mortgage
$50,000
Interest Rate
6.41%
Mortgage Type
Purchase Money Mortgage
Create a Home Valuation Report for This Property
The Home Valuation Report is an in-depth analysis detailing your home's value as well as a comparison with similar homes in the area
Home Values in the Area
Average Home Value in this Area
Purchase History
| Date | Buyer | Sale Price | Title Company |
|---|---|---|---|
| Rees Christine M | $560,000 | -- | |
| Rees Christine M | $560,000 | -- |
Source: Public Records
Mortgage History
| Date | Status | Borrower | Loan Amount |
|---|---|---|---|
| Open | Rees Christine M | $250,000 | |
| Closed | Rees Christine M | $224,000 | |
| Closed | Rees Christine M | $210,000 | |
| Closed | Rees Christine M | $50,000 |
Source: Public Records
Tax History
| Year | Tax Paid | Tax Assessment Tax Assessment Total Assessment is a certain percentage of the fair market value that is determined by local assessors to be the total taxable value of land and additions on the property. | Land | Improvement |
|---|---|---|---|---|
| 2024 | $10,596 | $822,700 | $507,500 | $315,200 |
| 2023 | $10,275 | $752,200 | $457,000 | $295,200 |
| 2022 | $9,310 | $637,700 | $397,500 | $240,200 |
| 2021 | $8,931 | $584,100 | $361,400 | $222,700 |
| 2020 | $8,592 | $572,400 | $352,700 | $219,700 |
| 2019 | $8,211 | $537,700 | $322,200 | $215,500 |
| 2018 | $7,970 | $509,600 | $309,800 | $199,800 |
| 2017 | $7,643 | $503,500 | $303,800 | $199,700 |
| 2016 | $7,486 | $505,100 | $303,800 | $201,300 |
| 2015 | $7,236 | $483,400 | $292,100 | $191,300 |
Source: Public Records
Map
Nearby Homes
- 105 Central St
- 3 Torr St
- 31 Porter Rd
- 4 Hammond Way
- 3 West Hollow
- 100.5 Main St Unit Q
- 96 N Main St Unit 3
- 11 Rennie Dr
- 18 Dale St Unit 9D
- 33 Chestnut St Unit 2
- Lot 7 Weeping Willow Dr
- 56 Sunset Rock Rd
- 53 Salem St
- 5 Lewis St
- 52 Salem St
- 4 Hazelwood Cir
- 1 Sweeney Ct
- 2 Powder Mill Square Unit 2B
- 104 Salem St
- 241 Lowell St Unit 3
- 4 Hartford Cir
- 24 Abbot Bridge Dr
- 25 Abbot Bridge Dr
- 6 Hartford Cir
- 3 Jefferson Ln
- 23 Abbot Bridge Dr
- 30 Abbot Bridge Dr
- 27 Abbot Bridge Dr
- 3 Hartford Cir
- 5 Jefferson Ln
- 5 Hartford Cir
- 8 Hartford Cir
- 21 Abbot Bridge Dr
- 7 Jefferson Ln
- 29 Abbot Bridge Dr
- 7 Hartford Cir
- 10 Hartford Cir
- 9 Jefferson Ln
- 20 Abbot Bridge Dr
- 9 Hartford Cir
Your Personal Tour Guide
Ask me questions while you tour the home.