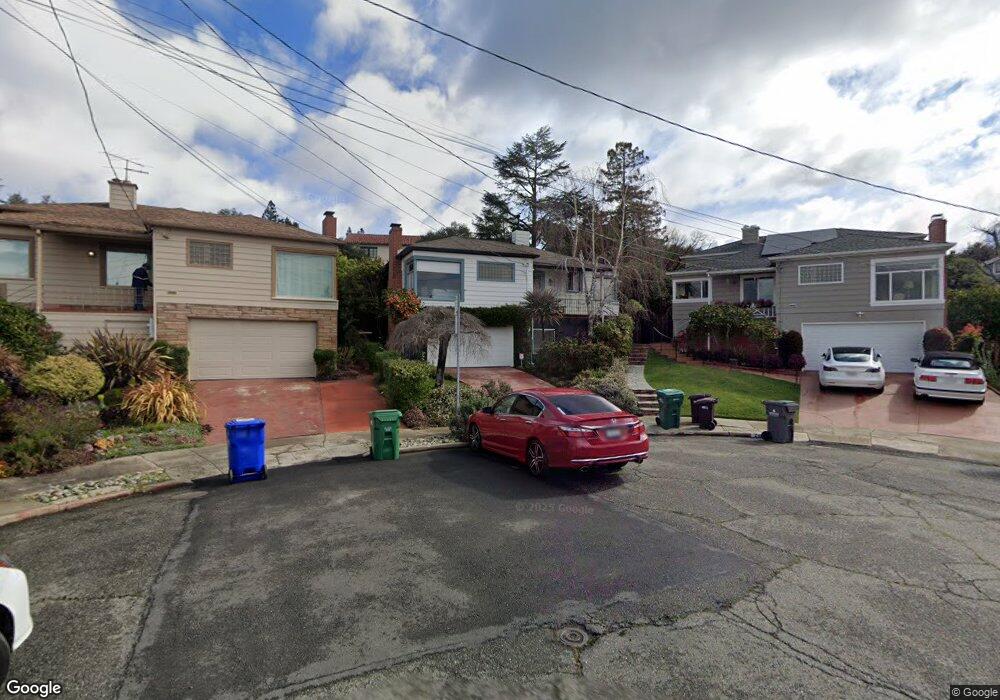
26 Alida Ct Oakland, CA 94602
Lincoln Highlands NeighborhoodEstimated Value: $1,041,000 - $1,335,000
3
Beds
1
Bath
1,634
Sq Ft
$692/Sq Ft
Est. Value
About This Home
This home is located at 26 Alida Ct, Oakland, CA 94602 and is currently estimated at $1,130,657, approximately $691 per square foot. 26 Alida Ct is a home located in Alameda County with nearby schools including Sequoia Elementary School, Bret Harte Middle School, and Skyline High School.
Ownership History
Date
Name
Owned For
Owner Type
Purchase Details
Closed on
Sep 2, 2008
Sold by
Sigars Judy
Bought by
Sigars Judith and The Judith Sigars Trust
Current Estimated Value
Purchase Details
Closed on
Oct 26, 1998
Sold by
Conklin Sid F and Likely Laura B
Bought by
Sigars Judy
Home Financials for this Owner
Home Financials are based on the most recent Mortgage that was taken out on this home.
Original Mortgage
$223,300
Outstanding Balance
$48,784
Interest Rate
6.6%
Estimated Equity
$1,081,873
Purchase Details
Closed on
Oct 25, 1994
Sold by
Simons Michael and Simons Tomoko
Bought by
Conklin Sid F and Likely Laura B
Home Financials for this Owner
Home Financials are based on the most recent Mortgage that was taken out on this home.
Original Mortgage
$222,800
Interest Rate
8.7%
Create a Home Valuation Report for This Property
The Home Valuation Report is an in-depth analysis detailing your home's value as well as a comparison with similar homes in the area
Home Values in the Area
Average Home Value in this Area
Purchase History
| Date | Buyer | Sale Price | Title Company |
|---|---|---|---|
| Sigars Judith | -- | None Available | |
| Sigars Judy | $319,000 | Chicago Title Co | |
| Conklin Sid F | $278,500 | First American Title Guarant |
Source: Public Records
Mortgage History
| Date | Status | Borrower | Loan Amount |
|---|---|---|---|
| Open | Sigars Judy | $223,300 | |
| Previous Owner | Conklin Sid F | $222,800 | |
| Closed | Conklin Sid F | $27,850 |
Source: Public Records
Tax History Compared to Growth
Tax History
| Year | Tax Paid | Tax Assessment Tax Assessment Total Assessment is a certain percentage of the fair market value that is determined by local assessors to be the total taxable value of land and additions on the property. | Land | Improvement |
|---|---|---|---|---|
| 2025 | $7,791 | $493,070 | $150,021 | $350,049 |
| 2024 | $7,791 | $483,267 | $147,080 | $343,187 |
| 2023 | $8,142 | $480,655 | $144,196 | $336,459 |
| 2022 | $7,900 | $464,232 | $141,369 | $329,863 |
| 2021 | $7,505 | $454,994 | $138,598 | $323,396 |
| 2020 | $7,417 | $457,257 | $137,177 | $320,080 |
| 2019 | $7,105 | $448,293 | $134,488 | $313,805 |
| 2018 | $6,950 | $439,504 | $131,851 | $307,653 |
| 2017 | $6,665 | $430,888 | $129,266 | $301,622 |
| 2016 | $6,534 | $422,441 | $126,732 | $295,709 |
| 2015 | $6,615 | $416,097 | $124,829 | $291,268 |
| 2014 | $6,619 | $407,946 | $122,384 | $285,562 |
Source: Public Records
Map
Nearby Homes
- 4224 Lincoln Ave
- 4271 Whittle Ave
- 2471 Burlington St
- 2436 Potomac St
- 4019 Rhoda Ave
- 37 Coolidge Terrace
- 1975 Wrenn St
- 1989 Oakview Dr
- 2510 Delmer St
- 4445 Arcadia Ave
- 2808 Carmel St
- 2818 Steinmetz Way
- 4751 Lincoln Ave
- 3875 Coolidge Ave
- 3853 Rhoda Ave
- 3873 Coolidge Ave
- 3826 Lincoln Ave
- 3887 Forest Hill Ave
- 1942 Leimert Blvd
- 2093 Braemar Rd