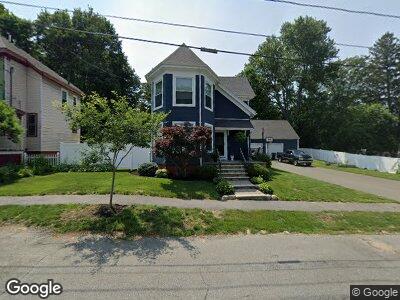
26 Allen St Haverhill, MA 01835
Central Bradford NeighborhoodEstimated Value: $582,228 - $676,000
5
Beds
2
Baths
2,074
Sq Ft
$302/Sq Ft
Est. Value
About This Home
This home is located at 26 Allen St, Haverhill, MA 01835 and is currently estimated at $627,307, approximately $302 per square foot. 26 Allen St is a home located in Essex County with nearby schools including Greenleaf Academy, Bradford Elementary School, and Haverhill High School.
Ownership History
Date
Name
Owned For
Owner Type
Purchase Details
Closed on
May 1, 1996
Sold by
26 Allen Street Rt
Bought by
Leblanc Stephen J
Current Estimated Value
Home Financials for this Owner
Home Financials are based on the most recent Mortgage that was taken out on this home.
Original Mortgage
$50,000
Interest Rate
7.82%
Mortgage Type
Purchase Money Mortgage
Create a Home Valuation Report for This Property
The Home Valuation Report is an in-depth analysis detailing your home's value as well as a comparison with similar homes in the area
Home Values in the Area
Average Home Value in this Area
Purchase History
| Date | Buyer | Sale Price | Title Company |
|---|---|---|---|
| Leblanc Stephen J | $125,000 | -- |
Source: Public Records
Mortgage History
| Date | Status | Borrower | Loan Amount |
|---|---|---|---|
| Open | Leblanc Stephen J | $200,000 | |
| Closed | Leblanc James | $183,500 | |
| Closed | Leblanc James | $142,500 | |
| Closed | Leblanc James | $80,000 | |
| Closed | Leblanc James | $50,000 |
Source: Public Records
Tax History Compared to Growth
Tax History
| Year | Tax Paid | Tax Assessment Tax Assessment Total Assessment is a certain percentage of the fair market value that is determined by local assessors to be the total taxable value of land and additions on the property. | Land | Improvement |
|---|---|---|---|---|
| 2025 | $5,587 | $521,700 | $175,100 | $346,600 |
| 2024 | $5,189 | $487,700 | $175,100 | $312,600 |
| 2023 | $5,083 | $455,900 | $175,100 | $280,800 |
| 2022 | $5,117 | $402,300 | $159,000 | $243,300 |
| 2021 | $4,891 | $363,900 | $144,500 | $219,400 |
| 2020 | $4,775 | $351,100 | $139,700 | $211,400 |
| 2019 | $4,475 | $320,800 | $128,500 | $192,300 |
| 2018 | $4,154 | $291,300 | $122,100 | $169,200 |
| 2017 | $3,879 | $258,800 | $102,800 | $156,000 |
| 2016 | $3,643 | $237,200 | $102,800 | $134,400 |
| 2015 | $3,592 | $234,000 | $99,600 | $134,400 |
Source: Public Records
Map
Nearby Homes
- 301 S Main St
- 14 Leroy Ave
- 282 S Main St
- 18 Church St
- 11 Haseltine St Unit B
- 83 S Prospect St
- 12 Salem St Unit 2
- 177 S Pleasant St
- 3 Parkview Ln Unit D
- 16 Doane St
- 98 Haseltine St
- 125 Colby St
- 14 Greystone Ave
- 90 Den Worth Bell Cir Unit 90
- 62 Washington St Unit 13
- 24 Washington St Unit 402
- 72 River St Unit 8
- 57 Washington St Unit 3D
- 89 Washington St Unit 2A
- 14 Pond St
- 26 Allen St
- 45 Allen St
- 22 Allen St
- 32 Allen St
- 17 Allen St
- 17 Allen St Unit 1st floor
- 18 Allen St
- 13 Allen St
- 27 S Prospect St Unit 3
- 27 S Prospect St Unit 2
- 27 S Prospect St Unit 1
- 14 Allen St
- 27 Allen St
- 36 Allen St Unit 38
- 29 Allen St
- 23 S Prospect St
- 15 S Prospect St
- 42 Allen St
- 31 Allen St
- 11 Allen St