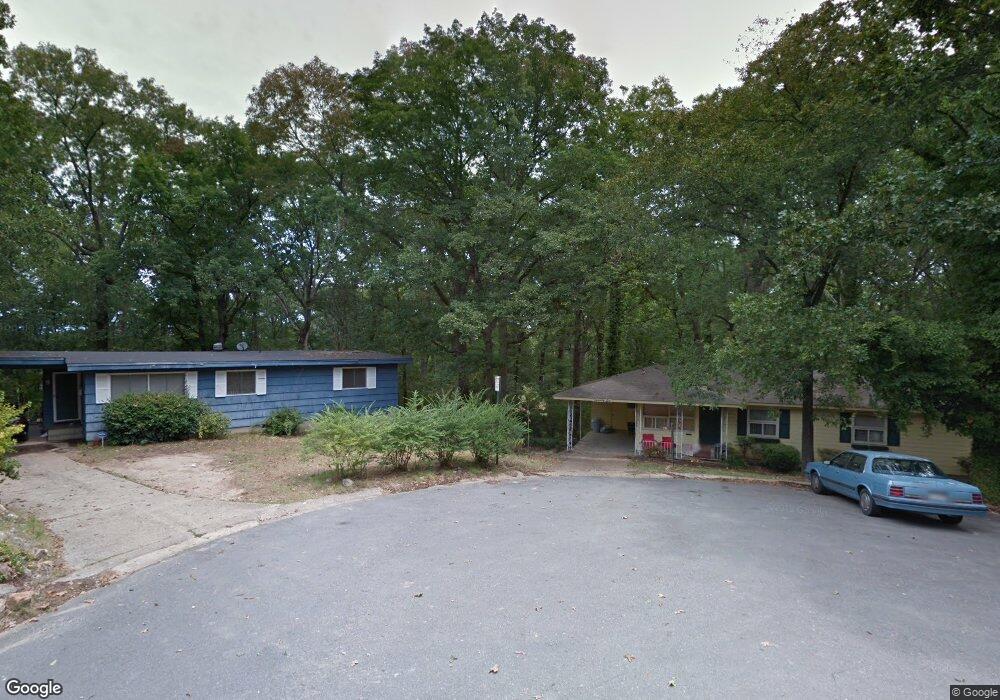
26 Ardmore Dr Little Rock, AR 72209
65th Street West NeighborhoodEstimated Value: $115,000 - $137,000
--
Bed
3
Baths
1,608
Sq Ft
$79/Sq Ft
Est. Value
About This Home
This home is located at 26 Ardmore Dr, Little Rock, AR 72209 and is currently estimated at $127,333, approximately $79 per square foot. 26 Ardmore Dr is a home located in Pulaski County with nearby schools including Mabelvale Middle School, Little Rock Southwest High School, and Exalt Academy of Southwest Little Rock.
Ownership History
Date
Name
Owned For
Owner Type
Purchase Details
Closed on
Sep 8, 2025
Sold by
Ultra Holdings Llc
Bought by
Rei Realty Llc
Current Estimated Value
Home Financials for this Owner
Home Financials are based on the most recent Mortgage that was taken out on this home.
Original Mortgage
$4,924,304
Outstanding Balance
$4,800,201
Interest Rate
6.58%
Mortgage Type
New Conventional
Estimated Equity
-$4,672,868
Purchase Details
Closed on
Dec 10, 2017
Sold by
Ultra Holdings Llc
Bought by
Criollo Mellado Gabriel
Purchase Details
Closed on
Jan 31, 2017
Sold by
Keeland Amy Elizabeth
Bought by
Ultra Holdings Llc
Purchase Details
Closed on
Jun 20, 2002
Sold by
Gray Tomps S and Gray Barbara Dell
Bought by
Gray Tomps S and Gray Barbara D
Home Financials for this Owner
Home Financials are based on the most recent Mortgage that was taken out on this home.
Original Mortgage
$53,000
Interest Rate
6.76%
Mortgage Type
Purchase Money Mortgage
Create a Home Valuation Report for This Property
The Home Valuation Report is an in-depth analysis detailing your home's value as well as a comparison with similar homes in the area
Home Values in the Area
Average Home Value in this Area
Purchase History
| Date | Buyer | Sale Price | Title Company |
|---|---|---|---|
| Rei Realty Llc | $4,347,693 | American Abstract & Title | |
| Criollo Mellado Gabriel | $89,900 | None Listed On Document | |
| Ultra Holdings Llc | $170,000 | American Abstract & Title Co | |
| Gray Tomps S | -- | American Abstract & Title Co |
Source: Public Records
Mortgage History
| Date | Status | Borrower | Loan Amount |
|---|---|---|---|
| Open | Rei Realty Llc | $4,924,304 | |
| Previous Owner | Gray Tomps S | $53,000 |
Source: Public Records
Tax History Compared to Growth
Tax History
| Year | Tax Paid | Tax Assessment Tax Assessment Total Assessment is a certain percentage of the fair market value that is determined by local assessors to be the total taxable value of land and additions on the property. | Land | Improvement |
|---|---|---|---|---|
| 2025 | $1,499 | $21,412 | $2,600 | $18,812 |
| 2024 | $937 | $21,412 | $2,600 | $18,812 |
| 2023 | $937 | $21,412 | $2,600 | $18,812 |
| 2022 | $859 | $21,412 | $2,600 | $18,812 |
| 2021 | $786 | $11,150 | $900 | $10,250 |
| 2020 | $781 | $11,150 | $900 | $10,250 |
| 2019 | $781 | $11,150 | $900 | $10,250 |
| 2018 | $781 | $11,150 | $900 | $10,250 |
| 2017 | $781 | $11,150 | $900 | $10,250 |
| 2016 | $956 | $13,660 | $2,600 | $11,060 |
| 2015 | $958 | $13,660 | $2,600 | $11,060 |
| 2014 | $958 | $13,660 | $2,600 | $11,060 |
Source: Public Records
Map
Nearby Homes
- 27 Westmont Cir
- 17 Belmar Dr
- 5 Delrose Dr
- 48 Westmont Cir
- 22 Lamont Dr
- 15 Lamont Dr
- 11 Lamont Dr
- 1 W Windsor Dr
- TBD Cardinal Rd
- 35 Windsor Dr
- 40 W Windsor Dr
- 00 S University Ave
- 29 Rosewood Dr
- 5900-5908 Geyer Springs
- 5223 Mabelvale Pike
- 8012 Westwood Ave
- 5116 Nancy Ct
- 5419 Western Ln
- 5424 W 51st St
- 7707 W 45th St
- 35 Ardmore Dr
- 24 Ardmore Dr
- 67 N Meadowcliff Dr
- 65 N Meadowcliff Dr
- 63 N Meadowcliff Dr
- 69 N Meadowcliff Dr
- 22 Ardmore Dr
- 33 Ardmore Dr
- 61 N Meadowcliff Dr
- 31 Ardmore Dr
- 20 Ardmore Dr
- 29 Ardmore Dr
- 62 N Meadowcliff Dr
- 64 N Meadowcliff Dr
- 66 N Meadowcliff Dr
- 68 N Meadowcliff Dr
- 70 N Meadowcliff Dr
- 60 N Meadowcliff Dr
- 25 Ardmore Dr
- 57 N Meadowcliff Dr