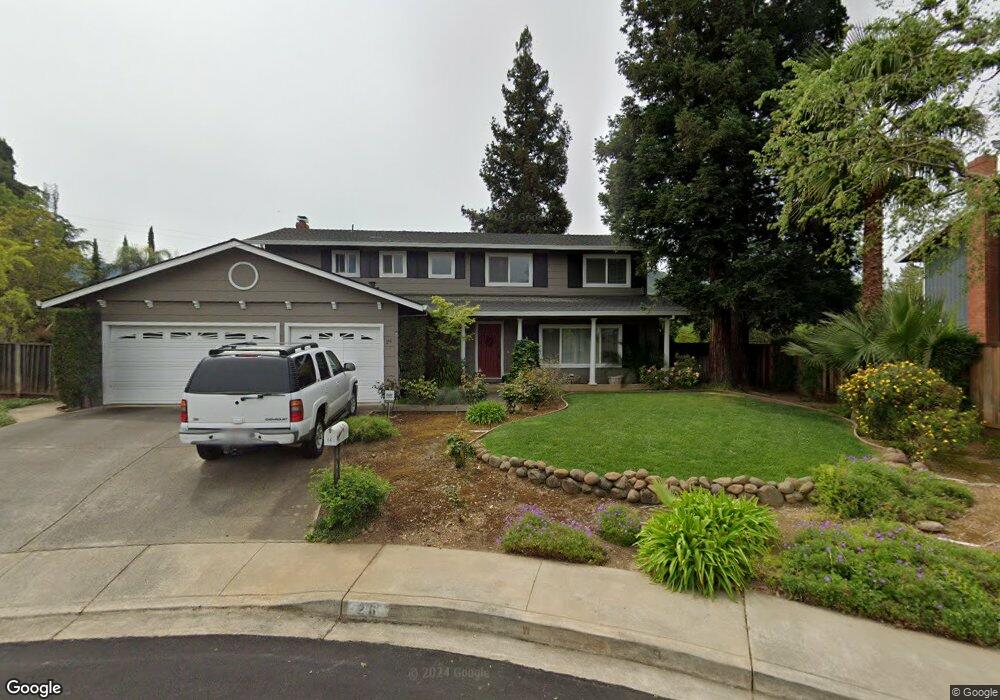
26 Atchinson Stage Ct Clayton, CA 94517
Estimated Value: $1,064,000 - $1,161,000
5
Beds
3
Baths
2,260
Sq Ft
$495/Sq Ft
Est. Value
About This Home
This home is located at 26 Atchinson Stage Ct, Clayton, CA 94517 and is currently estimated at $1,118,385, approximately $494 per square foot. 26 Atchinson Stage Ct is a home located in Contra Costa County with nearby schools including Mt. Diablo Elementary School, Diablo View Middle School, and College Park High School.
Ownership History
Date
Name
Owned For
Owner Type
Purchase Details
Closed on
Jan 10, 2025
Sold by
Griep Mark R and Griep Celia A
Bought by
Mark And Celia Griep Living Trust and Griep
Current Estimated Value
Purchase Details
Closed on
Aug 10, 1998
Sold by
Wilson Karin U
Bought by
Griep Mark R and Griep Celia A
Home Financials for this Owner
Home Financials are based on the most recent Mortgage that was taken out on this home.
Original Mortgage
$228,150
Interest Rate
6.95%
Mortgage Type
Purchase Money Mortgage
Purchase Details
Closed on
Sep 27, 1996
Sold by
Dawson Richard C and Dawson Lesta G
Bought by
Wilson Karin U
Home Financials for this Owner
Home Financials are based on the most recent Mortgage that was taken out on this home.
Original Mortgage
$239,200
Interest Rate
7.95%
Mortgage Type
Purchase Money Mortgage
Create a Home Valuation Report for This Property
The Home Valuation Report is an in-depth analysis detailing your home's value as well as a comparison with similar homes in the area
Home Values in the Area
Average Home Value in this Area
Purchase History
| Date | Buyer | Sale Price | Title Company |
|---|---|---|---|
| Mark And Celia Griep Living Trust | -- | None Listed On Document | |
| Mark And Celia Griep Living Trust | -- | None Listed On Document | |
| Griep Mark R | $335,000 | Placer Title Company | |
| Wilson Karin U | $299,000 | Fidelity National Title Co |
Source: Public Records
Mortgage History
| Date | Status | Borrower | Loan Amount |
|---|---|---|---|
| Previous Owner | Griep Mark R | $228,150 | |
| Previous Owner | Wilson Karin U | $239,200 |
Source: Public Records
Tax History Compared to Growth
Tax History
| Year | Tax Paid | Tax Assessment Tax Assessment Total Assessment is a certain percentage of the fair market value that is determined by local assessors to be the total taxable value of land and additions on the property. | Land | Improvement |
|---|---|---|---|---|
| 2025 | $6,890 | $525,159 | $258,659 | $266,500 |
| 2024 | $6,751 | $514,863 | $253,588 | $261,275 |
| 2023 | $6,751 | $504,768 | $248,616 | $256,152 |
| 2022 | $6,650 | $494,872 | $243,742 | $251,130 |
| 2021 | $6,480 | $485,169 | $238,963 | $246,206 |
| 2019 | $6,346 | $470,780 | $231,876 | $238,904 |
| 2018 | $6,105 | $461,550 | $227,330 | $234,220 |
| 2017 | $5,899 | $452,501 | $222,873 | $229,628 |
| 2016 | $5,731 | $443,629 | $218,503 | $225,126 |
| 2015 | $5,657 | $436,966 | $215,221 | $221,745 |
| 2014 | $5,552 | $428,408 | $211,006 | $217,402 |
Source: Public Records
Map
Nearby Homes
- 5647 Southbrook Dr
- 5665 Lewis Way
- 814 Chert Place
- 5900 High St
- 415 Chupcan Place Unit 3
- 5555 Alabama Dr
- 1731 Indian Wells Way
- 1170 Ridgemont Place
- 1498 Delaware Dr
- 5540 Michigan Blvd
- 931 Arrowhead Terrace
- 1221 Buckeye Terrace
- 1816 Eagle Peak Ave
- 5872 Herriman Dr
- 5494 Haussner Dr
- 5503 Pennsylvania Blvd
- 1338 Shell Ln
- 1835 Camino Estrada
- 1181 Blue Lake Way
- 1343 Shell Ln
- 7 Atchinson Stage Place
- 20 Atchinson Stage Ct
- 32 Atchinson Stage Ct
- 13 Atchinson Stage Place
- 1 Atchinson Stage Place
- 13 Atchinson Stage Ct
- 37 Nottingham Cir
- 31 Nottingham CI
- 31 Nottingham Cir
- 7 Atchinson Stage Ct
- 25 Nottingham CI
- 25 Nottingham Cir
- 43 Nottingham Cir
- 1 Atchinson Stage Ct
- 20 Atchinson Stage Place
- 19 Nottingham Cir
- 5757 Verna Way
- 25 Atchinson Stage Rd
- 13 Nottingham Cir
- 26 Atchinson Stage Place