26 Augusta Dr Newark, DE 19713
Estimated Value: $319,301 - $341,000
3
Beds
2
Baths
1,282
Sq Ft
$257/Sq Ft
Est. Value
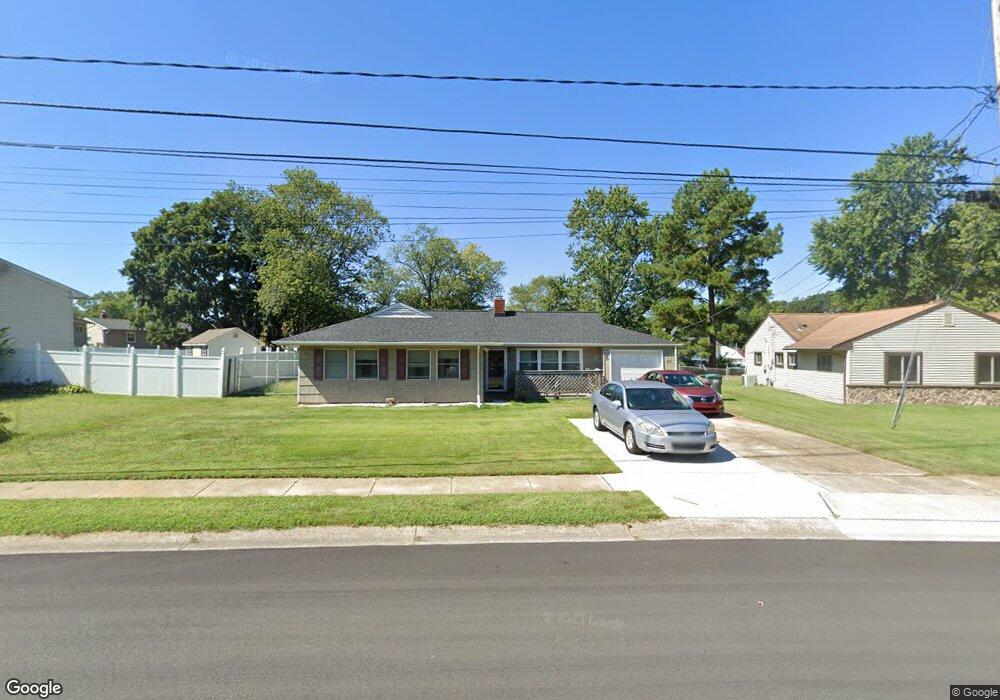
About This Home
This home is located at 26 Augusta Dr, Newark, DE 19713 and is currently estimated at $329,575, approximately $257 per square foot. 26 Augusta Dr is a home located in New Castle County with nearby schools including Smith (Jennie E.) Elementary School, Kirk (George V.) Middle School, and Christiana High School.
Ownership History
Date
Name
Owned For
Owner Type
Purchase Details
Closed on
Feb 23, 2007
Sold by
Breakiron Nicole A and Breakiron David A
Bought by
Green Doretha T and Green Dawson M
Current Estimated Value
Home Financials for this Owner
Home Financials are based on the most recent Mortgage that was taken out on this home.
Original Mortgage
$130,000
Outstanding Balance
$78,167
Interest Rate
6.23%
Mortgage Type
Purchase Money Mortgage
Estimated Equity
$251,408
Purchase Details
Closed on
Sep 13, 2004
Sold by
Breakiron David A and Keen Nicole A
Bought by
Breakiron David A and Breakiron Nicole A
Purchase Details
Closed on
Oct 30, 2001
Sold by
Murphy Raymond J
Bought by
Breakiron David A and Keen Nicole A
Home Financials for this Owner
Home Financials are based on the most recent Mortgage that was taken out on this home.
Original Mortgage
$121,292
Interest Rate
6.82%
Mortgage Type
FHA
Create a Home Valuation Report for This Property
The Home Valuation Report is an in-depth analysis detailing your home's value as well as a comparison with similar homes in the area
Home Values in the Area
Average Home Value in this Area
Purchase History
| Date | Buyer | Sale Price | Title Company |
|---|---|---|---|
| Green Doretha T | $218,000 | None Available | |
| Breakiron David A | -- | -- | |
| Breakiron David A | $124,500 | -- |
Source: Public Records
Mortgage History
| Date | Status | Borrower | Loan Amount |
|---|---|---|---|
| Open | Green Doretha T | $130,000 | |
| Previous Owner | Breakiron David A | $121,292 | |
| Closed | Breakiron David A | $5,000 |
Source: Public Records
Tax History
| Year | Tax Paid | Tax Assessment Tax Assessment Total Assessment is a certain percentage of the fair market value that is determined by local assessors to be the total taxable value of land and additions on the property. | Land | Improvement |
|---|---|---|---|---|
| 2024 | $1,131 | $43,500 | $8,200 | $35,300 |
| 2023 | $1,092 | $43,500 | $8,200 | $35,300 |
| 2022 | $1,068 | $43,500 | $8,200 | $35,300 |
| 2021 | $1,082 | $43,500 | $8,200 | $35,300 |
| 2020 | $1,082 | $43,500 | $8,200 | $35,300 |
| 2019 | $985 | $43,500 | $8,200 | $35,300 |
| 2018 | $860 | $43,500 | $8,200 | $35,300 |
| 2017 | $825 | $43,500 | $8,200 | $35,300 |
| 2016 | $719 | $43,500 | $8,200 | $35,300 |
| 2015 | $637 | $43,500 | $8,200 | $35,300 |
| 2014 | $637 | $43,500 | $8,200 | $35,300 |
Source: Public Records
Map
Nearby Homes
Your Personal Tour Guide
Ask me questions while you tour the home.