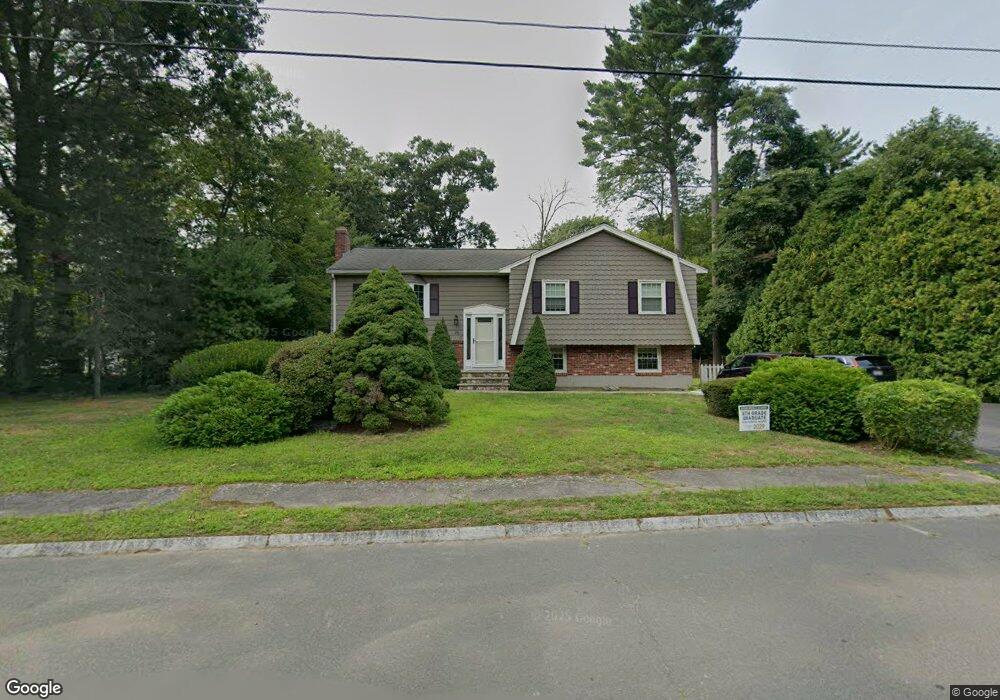
26 Barton Rd Foxboro, MA 02035
Estimated Value: $661,000 - $691,000
3
Beds
2
Baths
1,816
Sq Ft
$372/Sq Ft
Est. Value
About This Home
This home is located at 26 Barton Rd, Foxboro, MA 02035 and is currently estimated at $675,296, approximately $371 per square foot. 26 Barton Rd is a home located in Norfolk County with nearby schools including Foxborough High School, Discovery Daycare Center, and Hands-On-Montessori School.
Ownership History
Date
Name
Owned For
Owner Type
Purchase Details
Closed on
Aug 29, 2008
Sold by
Child Richard H
Bought by
Fitzgerald John J and Fitzgerald Michelle
Current Estimated Value
Purchase Details
Closed on
Mar 26, 1999
Sold by
Department Of Housing & Urban Dev
Bought by
Child Richard H
Purchase Details
Closed on
Sep 14, 1998
Sold by
Freeman Darrin D Est
Bought by
Fleet Mtg Corp
Purchase Details
Closed on
Feb 16, 1995
Sold by
Freeman Robert D and Freeman Janet A
Bought by
Jackson Michael J and Freeman Darrini D
Create a Home Valuation Report for This Property
The Home Valuation Report is an in-depth analysis detailing your home's value as well as a comparison with similar homes in the area
Home Values in the Area
Average Home Value in this Area
Purchase History
| Date | Buyer | Sale Price | Title Company |
|---|---|---|---|
| Fitzgerald John J | $335,000 | -- | |
| Child Richard H | $151,100 | -- | |
| Fleet Mtg Corp | $158,791 | -- | |
| Jackson Michael J | $142,000 | -- |
Source: Public Records
Mortgage History
| Date | Status | Borrower | Loan Amount |
|---|---|---|---|
| Open | Jackson Michael J | $210,000 | |
| Closed | Jackson Michael J | $190,000 |
Source: Public Records
Tax History Compared to Growth
Tax History
| Year | Tax Paid | Tax Assessment Tax Assessment Total Assessment is a certain percentage of the fair market value that is determined by local assessors to be the total taxable value of land and additions on the property. | Land | Improvement |
|---|---|---|---|---|
| 2025 | $7,194 | $544,200 | $239,200 | $305,000 |
| 2024 | $6,877 | $509,000 | $243,600 | $265,400 |
| 2023 | $6,710 | $472,200 | $231,900 | $240,300 |
| 2022 | $6,120 | $421,500 | $194,500 | $227,000 |
| 2021 | $5,684 | $385,600 | $180,100 | $205,500 |
| 2020 | $5,295 | $363,400 | $180,100 | $183,300 |
| 2019 | $5,169 | $351,600 | $171,500 | $180,100 |
| 2018 | $5,031 | $345,300 | $171,500 | $173,800 |
| 2017 | $5,147 | $342,200 | $160,300 | $181,900 |
| 2016 | $5,218 | $352,100 | $161,500 | $190,600 |
| 2015 | $5,023 | $330,700 | $136,600 | $194,100 |
| 2014 | $4,458 | $297,400 | $127,600 | $169,800 |
Source: Public Records
Map
Nearby Homes
- 24 Maverick Dr
- 16 Treasure Island Rd
- 85 Jewell St
- 93 Plain St
- 46 Mirimichi St
- 9 Oak Dr
- 78 Old Farm Rd
- 150 Gilbert St
- 116 George St
- 14 Claire Ave
- 356 Central St
- 152 Central St
- 155 South St
- 166 Chauncy St
- 28 Messenger St
- 126 Washington St
- 130 Washington St
- 124 Washington St
- 196 Donald Tennant Cir
- 12 Spring St