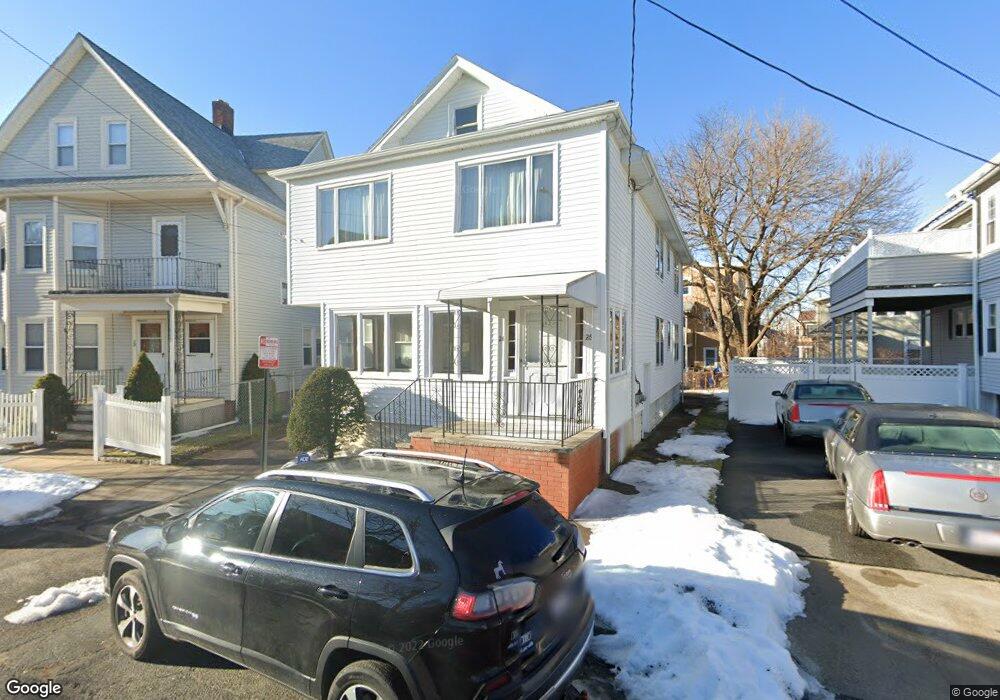
26 Belmont Park Everett, MA 02149
West Everett NeighborhoodEstimated Value: $730,000 - $815,000
4
Beds
2
Baths
2,240
Sq Ft
$350/Sq Ft
Est. Value
About This Home
This home is located at 26 Belmont Park, Everett, MA 02149 and is currently estimated at $784,013, approximately $350 per square foot. 26 Belmont Park is a home located in Middlesex County with nearby schools including Everett High School, Pioneer Charter School of Science, and St Anthony School.
Ownership History
Date
Name
Owned For
Owner Type
Purchase Details
Closed on
Sep 24, 2008
Sold by
Marra Anthony and Marra-Anderson Catherine
Bought by
Marra Peter
Current Estimated Value
Home Financials for this Owner
Home Financials are based on the most recent Mortgage that was taken out on this home.
Original Mortgage
$544,185
Outstanding Balance
$362,824
Interest Rate
6.57%
Mortgage Type
Purchase Money Mortgage
Estimated Equity
$421,189
Create a Home Valuation Report for This Property
The Home Valuation Report is an in-depth analysis detailing your home's value as well as a comparison with similar homes in the area
Home Values in the Area
Average Home Value in this Area
Purchase History
| Date | Buyer | Sale Price | Title Company |
|---|---|---|---|
| Marra Peter | $102,000 | -- |
Source: Public Records
Mortgage History
| Date | Status | Borrower | Loan Amount |
|---|---|---|---|
| Open | Marra Peter | $544,185 |
Source: Public Records
Tax History Compared to Growth
Tax History
| Year | Tax Paid | Tax Assessment Tax Assessment Total Assessment is a certain percentage of the fair market value that is determined by local assessors to be the total taxable value of land and additions on the property. | Land | Improvement |
|---|---|---|---|---|
| 2025 | $7,767 | $681,900 | $252,000 | $429,900 |
| 2024 | $7,064 | $616,400 | $220,800 | $395,600 |
| 2023 | $6,895 | $585,300 | $211,200 | $374,100 |
| 2022 | $6,193 | $597,800 | $201,600 | $396,200 |
| 2021 | $5,542 | $561,500 | $180,500 | $381,000 |
| 2020 | $5,834 | $548,300 | $180,500 | $367,800 |
| 2019 | $6,185 | $499,600 | $171,800 | $327,800 |
| 2018 | $6,059 | $439,700 | $149,800 | $289,900 |
| 2017 | $5,474 | $379,100 | $115,200 | $263,900 |
| 2016 | $5,079 | $351,500 | $115,200 | $236,300 |
| 2015 | $4,823 | $330,100 | $108,000 | $222,100 |
Source: Public Records
Map
Nearby Homes
- 98 Bradford St
- 210 Hancock St
- 55 Clarendon St
- 16 Woodville St
- 340 Main St
- 103 Swan St
- 32 Central Ave
- 315 Main St
- 21 Central Ave Unit 10
- 21 Staples Ave Unit 25
- 48 Cleveland Ave
- 15 Staples Ave Unit 31
- 96 Clark St
- 28 Vernal St
- 12 Woodland St Unit 12
- 80 Main St Unit 9
- 58 Regent Rd
- 72 Ashland St Unit 307
- 4 Cross St Unit 1
- 25 Clark St
- 28 Belmont Park
- 99 Kinsman St
- 20 Belmont Park Unit 1
- 20 Belmont Park
- 103 Kinsman St
- 103 Kinsman St Unit 1
- 107 Kinsman St
- 18 Belmont Park Unit B
- 18 Belmont Park
- 18 Belmont Park Unit B
- 18 Belmont Park Unit 1
- 18 Belmont Park Unit A
- 95 Kinsman St
- 95 Kinsman St Unit 1
- 97 Kinsman St Unit 97
- 32 Belmont Park
- 93 Kinsman St
- 111 Kinsman St
- 27 Belmont Park
- 19 Belmont Park