


26 Bigelow St Quincy, MA 02169
Quincy Center Neighborhood
4
Beds
3
Baths
2,040
Sq Ft
4,721
Sq Ft Lot
Highlights
- Medical Services
- Colonial Architecture
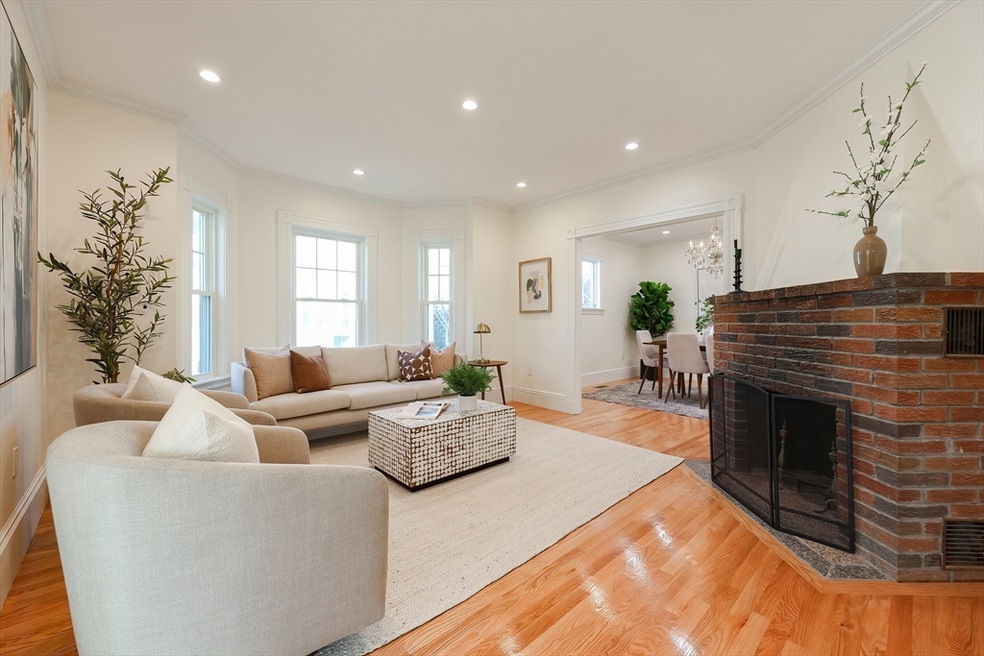
- 1 Fireplace
- Granite Flooring
- Property is near public transit
- No HOA
About This Home
As of February 2025Newly renovated home right in the heart of Quincy! You'll definitely want to take advantage of all the work that went into this Quincy Center gem since the recent sale in 2023. All new appliances, two new baths, a redone kitchen, and so much more. From floor to ceiling the property received a complete rejuvenation, while still preserving its 1920s charm. New forced air system, central AC, circuit breakers, hot water heater, flooring, drywall, roofing, windows, plumbing, electric, and the list goes on. How often do you see such a charming single family, with such modern amenities, so close to the best of Quincy? Don't wait for the next one, it may be a while, come tour this week!
Home Details
Home Type
- Single Family
Est. Annual Taxes
- $6,142
Year Built
- Built in 1920
Lot Details
- 4,721 Sq Ft Lot
- Property is zoned RESC
Home Design
- Colonial Architecture
- Frame Construction
- Shingle Roof
- Concrete Perimeter Foundation
Interior Spaces
- 2,040 Sq Ft Home
- 1 Fireplace
- Insulated Windows
Kitchen
- Oven
- Range with Range Hood
- Microwave
- Freezer
- Dishwasher
- Disposal
Flooring
- Wood
- Granite
- Tile
Bedrooms and Bathrooms
- 4 Bedrooms
- 3 Full Bathrooms
Laundry
- Dryer
- Washer
Unfinished Basement
- Basement Fills Entire Space Under The House
- Block Basement Construction
Parking
- Detached Garage
- Driveway
- Open Parking
- Off-Street Parking
Schools
- Marshall Elementary School
- Point Webster Middle School
- Quincy High School
Utilities
- Forced Air Heating and Cooling System
- 2 Cooling Zones
- 2 Heating Zones
- Heating System Uses Natural Gas
- 200+ Amp Service
- Gas Water Heater
Additional Features
- Outdoor Storage
- Property is near public transit
Listing and Financial Details
- Assessor Parcel Number M:1139 B:10,175223
Community Details
Overview
- No Home Owners Association
Amenities
- Medical Services
- Shops
Recreation
- Park
Ownership History
Date
Name
Owned For
Owner Type
Purchase Details
Closed on
Dec 13, 2021
Sold by
Garcia Michelle M and Scottsdale Rei Llc
Bought by
Scottsdale Rei Llc
Current Estimated Value
Purchase Details
Closed on
Jan 21, 2005
Sold by
Galicia Garcia E and Galicia Juliette M
Bought by
Garcia Michelle M
Home Financials for this Owner
Home Financials are based on the most recent Mortgage that was taken out on this home.
Original Mortgage
$160,000
Interest Rate
5.71%
Mortgage Type
Purchase Money Mortgage
Similar Homes in Quincy, MA
Create a Home Valuation Report for This Property
The Home Valuation Report is an in-depth analysis detailing your home's value as well as a comparison with similar homes in the area
Home Values in the Area
Average Home Value in this Area
Purchase History
| Date | Type | Sale Price | Title Company |
|---|---|---|---|
| Foreclosure Deed | $500,000 | None Available | |
| Foreclosure Deed | $500,000 | None Available | |
| Deed | $200,000 | -- | |
| Deed | $200,000 | -- |
Source: Public Records
Mortgage History
| Date | Status | Loan Amount | Loan Type |
|---|---|---|---|
| Open | $774,000 | Purchase Money Mortgage | |
| Closed | $774,000 | Purchase Money Mortgage | |
| Previous Owner | $299,000 | No Value Available | |
| Previous Owner | $262,000 | No Value Available | |
| Previous Owner | $160,000 | Purchase Money Mortgage |
Source: Public Records
Property History
| Date | Event | Price | Change | Sq Ft Price |
|---|---|---|---|---|
| 02/18/2025 02/18/25 | Sold | $896,000 | -0.3% | $439 / Sq Ft |
| 01/13/2025 01/13/25 | Pending | -- | -- | -- |
| 12/18/2024 12/18/24 | For Sale | $899,000 | +104.3% | $441 / Sq Ft |
| 08/18/2023 08/18/23 | Sold | $440,000 | -7.4% | $273 / Sq Ft |
| 06/28/2023 06/28/23 | Pending | -- | -- | -- |
| 06/20/2023 06/20/23 | For Sale | $475,000 | +8.0% | $295 / Sq Ft |
| 06/20/2023 06/20/23 | Off Market | $440,000 | -- | -- |
| 05/30/2023 05/30/23 | Price Changed | $475,000 | -6.8% | $295 / Sq Ft |
| 04/18/2023 04/18/23 | For Sale | $509,900 | 0.0% | $316 / Sq Ft |
| 12/27/2022 12/27/22 | Pending | -- | -- | -- |
| 12/08/2022 12/08/22 | For Sale | $509,900 | 0.0% | $316 / Sq Ft |
| 08/22/2022 08/22/22 | Pending | -- | -- | -- |
| 08/15/2022 08/15/22 | For Sale | $509,900 | -- | $316 / Sq Ft |
Source: MLS Property Information Network (MLS PIN)
Tax History Compared to Growth
Tax History
| Year | Tax Paid | Tax Assessment Tax Assessment Total Assessment is a certain percentage of the fair market value that is determined by local assessors to be the total taxable value of land and additions on the property. | Land | Improvement |
|---|---|---|---|---|
| 2025 | $7,501 | $650,600 | $263,500 | $387,100 |
| 2024 | $6,142 | $545,000 | $251,000 | $294,000 |
| 2023 | $5,638 | $506,600 | $228,200 | $278,400 |
| 2022 | $5,864 | $489,500 | $207,400 | $282,100 |
| 2021 | $5,548 | $457,000 | $207,400 | $249,600 |
| 2020 | $5,423 | $436,300 | $197,500 | $238,800 |
| 2019 | $5,287 | $421,300 | $186,400 | $234,900 |
| 2018 | $5,309 | $398,000 | $186,400 | $211,600 |
| 2017 | $5,292 | $373,500 | $177,500 | $196,000 |
| 2016 | $5,029 | $350,200 | $169,100 | $181,100 |
| 2015 | $4,923 | $337,200 | $169,100 | $168,100 |
| 2014 | $4,608 | $310,100 | $161,000 | $149,100 |
Source: Public Records
Agents Affiliated with this Home
-
G
Seller's Agent in 2025
Grace Kelly
Coldwell Banker Realty - Hingham
1 in this area
4 Total Sales
-
S
Buyer's Agent in 2025
Seunghwan Steven Lee
Premier Realty Group
1 in this area
3 Total Sales
-
T
Seller's Agent in 2023
The Ponte Group
Keller Williams South Watuppa
(508) 677-3233
1 in this area
762 Total Sales
-
N
Buyer's Agent in 2023
Non Member
Non Member Office
Map
Source: MLS Property Information Network (MLS PIN)
MLS Number: 73320659
APN: QUIN-001139-000000-000010
Disclaimer: Certain information contained herein is derived from information provided by parties other than Homes.com. All information provided is deemed reliable, but is not guaranteed to be accurate and should be independently verified.
![]() The property listing data and information, or the Images, set forth herein were provided to MLS Property Information Network, Inc. from third party sources, including sellers, lessors and public records, and were compiled by MLS Property Information Network, Inc. The property listing data and information, and the Images, are for the personal, non-commercial use of consumers having a good faith interest in purchasing or leasing listed properties of the type displayed to them and may not be used for any purpose other than to identify prospective properties which such consumers may have a good faith interest in purchasing or leasing. MLS Property Information Network, Inc. and its subscribers disclaim any and all representations and warranties as to the accuracy of the property listing data and information, or as to the accuracy of any of the Images, set forth herein.
The property listing data and information, or the Images, set forth herein were provided to MLS Property Information Network, Inc. from third party sources, including sellers, lessors and public records, and were compiled by MLS Property Information Network, Inc. The property listing data and information, and the Images, are for the personal, non-commercial use of consumers having a good faith interest in purchasing or leasing listed properties of the type displayed to them and may not be used for any purpose other than to identify prospective properties which such consumers may have a good faith interest in purchasing or leasing. MLS Property Information Network, Inc. and its subscribers disclaim any and all representations and warranties as to the accuracy of the property listing data and information, or as to the accuracy of any of the Images, set forth herein.
Nearby Homes
- 36 Bigelow St
- 91 Washington St Unit 8
- 2 Cliveden St Unit 503E
- 2 Cliveden St Unit 504
- 58 South St Unit 306
- 18 Cliveden St Unit 406W
- 57 Summer St
- 124 S Walnut St
- 145 S Walnut St
- 41 Hyde St
- 51 Sumner St
- 27 Mill St Unit B
- 293 Whitwell St
- 83 Water St
- 179 Presidents Ln Unit 4I
- 179 Presidents Ln Unit 2M
- 178 South St Unit 5
- 15 Vine Ave
- 20 Whitney Rd Unit 307
- 20 Whitney Rd Unit 101