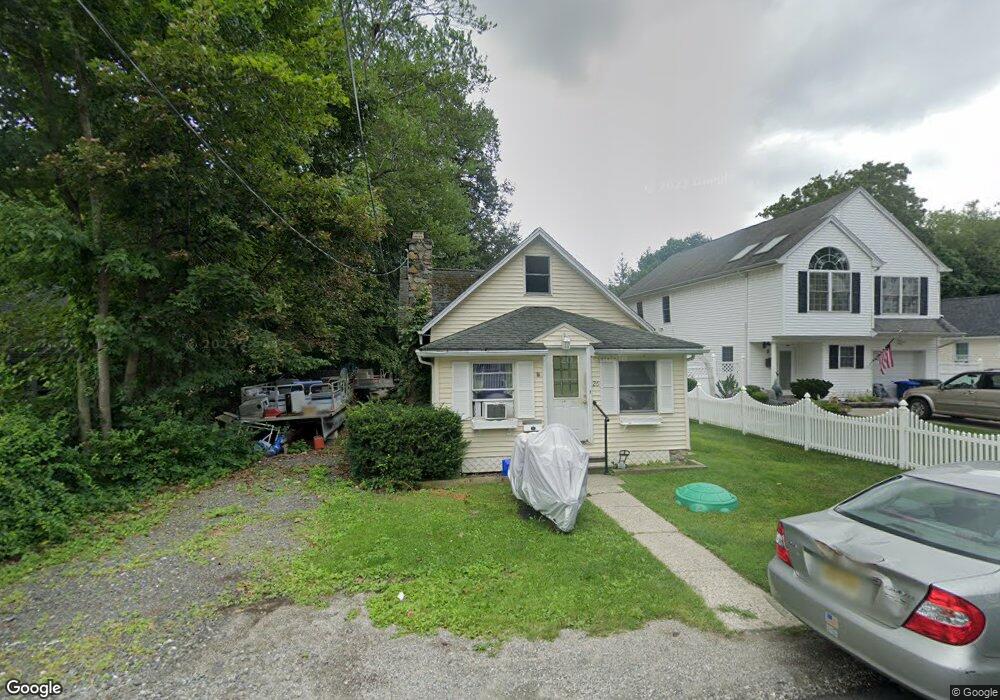
26 Center St Budd Lake, NJ 07828
Estimated Value: $313,394 - $353,000
--
Bed
--
Bath
1,131
Sq Ft
$298/Sq Ft
Est. Value
About This Home
This home is located at 26 Center St, Budd Lake, NJ 07828 and is currently estimated at $337,349, approximately $298 per square foot. 26 Center St is a home located in Morris County with nearby schools including Mt Olive Middle School and Mount Olive High School.
Ownership History
Date
Name
Owned For
Owner Type
Purchase Details
Closed on
Nov 6, 1998
Sold by
Fette Jeffrey
Bought by
Trojahn Harry and Trojahn Theresa
Current Estimated Value
Home Financials for this Owner
Home Financials are based on the most recent Mortgage that was taken out on this home.
Original Mortgage
$126,227
Outstanding Balance
$27,310
Interest Rate
6.49%
Mortgage Type
FHA
Estimated Equity
$310,039
Purchase Details
Closed on
Mar 31, 1998
Sold by
Beneficial New Jersey Inc
Bought by
Fette Jeffrey
Create a Home Valuation Report for This Property
The Home Valuation Report is an in-depth analysis detailing your home's value as well as a comparison with similar homes in the area
Home Values in the Area
Average Home Value in this Area
Purchase History
| Date | Buyer | Sale Price | Title Company |
|---|---|---|---|
| Trojahn Harry | $127,000 | -- | |
| Fette Jeffrey | $50,000 | Old Republic Natl Title Ins |
Source: Public Records
Mortgage History
| Date | Status | Borrower | Loan Amount |
|---|---|---|---|
| Open | Trojahn Harry | $126,227 |
Source: Public Records
Tax History Compared to Growth
Tax History
| Year | Tax Paid | Tax Assessment Tax Assessment Total Assessment is a certain percentage of the fair market value that is determined by local assessors to be the total taxable value of land and additions on the property. | Land | Improvement |
|---|---|---|---|---|
| 2025 | $5,719 | $164,100 | $111,700 | $52,400 |
| 2024 | $5,394 | $164,100 | $111,700 | $52,400 |
| 2023 | $5,394 | $164,100 | $111,700 | $52,400 |
| 2022 | $5,254 | $164,100 | $111,700 | $52,400 |
| 2021 | $5,254 | $164,100 | $111,700 | $52,400 |
| 2020 | $5,437 | $164,100 | $111,700 | $52,400 |
| 2019 | $5,419 | $164,100 | $111,700 | $52,400 |
| 2018 | $5,366 | $164,100 | $111,700 | $52,400 |
| 2017 | $5,273 | $164,100 | $111,700 | $52,400 |
| 2016 | $5,105 | $164,100 | $111,700 | $52,400 |
| 2015 | $5,225 | $164,100 | $111,700 | $52,400 |
| 2014 | $5,230 | $164,100 | $111,700 | $52,400 |
Source: Public Records
Map
Nearby Homes