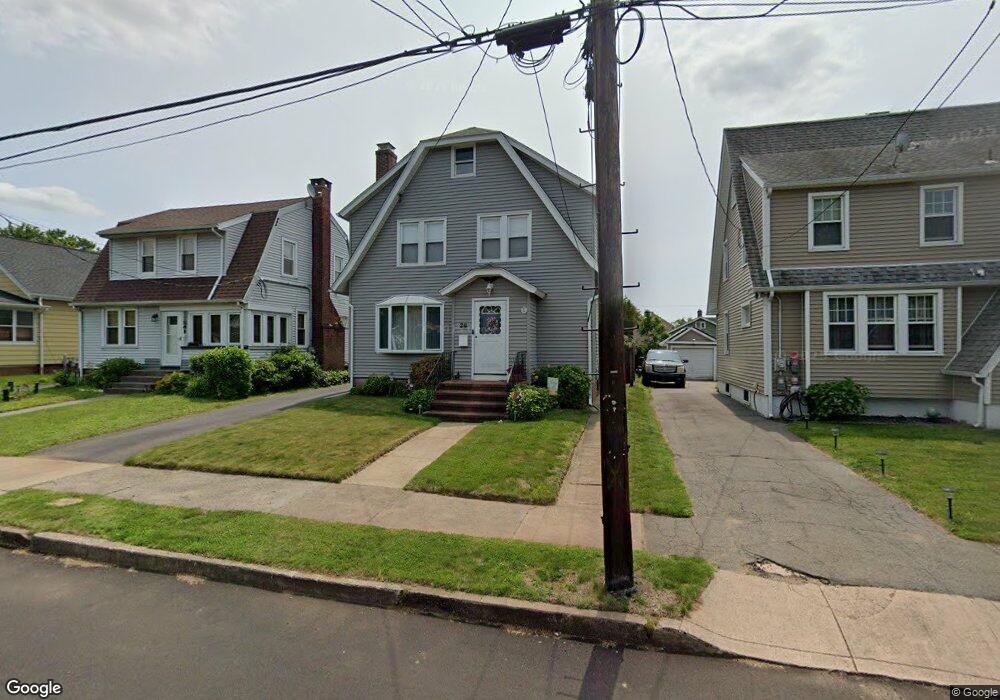
26 Chew St West Haven, CT 06516
West Haven Center NeighborhoodEstimated Value: $291,000 - $368,000
3
Beds
2
Baths
1,552
Sq Ft
$216/Sq Ft
Est. Value
About This Home
This home is located at 26 Chew St, West Haven, CT 06516 and is currently estimated at $335,398, approximately $216 per square foot. 26 Chew St is a home located in New Haven County with nearby schools including Carrigan 5/6 Intermediate School, Harry M. Bailey Middle School, and West Haven High School.
Ownership History
Date
Name
Owned For
Owner Type
Purchase Details
Closed on
Aug 17, 1998
Sold by
Fnma
Bought by
Schock Robert A and Schock Susan E
Current Estimated Value
Purchase Details
Closed on
Jul 31, 1992
Sold by
Carol-Edward Prtnrshp
Bought by
Jennes Lawrence R and Jennes Maureen H
Purchase Details
Closed on
May 4, 1990
Sold by
New Haven Inv Inc
Bought by
Carol Edward Ptnrshp
Purchase Details
Closed on
Mar 28, 1990
Sold by
Damato Andrew
Bought by
New Haven Inv Inc
Create a Home Valuation Report for This Property
The Home Valuation Report is an in-depth analysis detailing your home's value as well as a comparison with similar homes in the area
Home Values in the Area
Average Home Value in this Area
Purchase History
| Date | Buyer | Sale Price | Title Company |
|---|---|---|---|
| Schock Robert A | $75,000 | -- | |
| Jennes Lawrence R | $130,000 | -- | |
| Schock Robert A | $75,000 | -- | |
| Jennes Lawrence R | $130,000 | -- | |
| Carol Edward Ptnrshp | $110,000 | -- | |
| New Haven Inv Inc | $108,806 | -- |
Source: Public Records
Mortgage History
| Date | Status | Borrower | Loan Amount |
|---|---|---|---|
| Closed | New Haven Inv Inc | $145,200 | |
| Closed | New Haven Inv Inc | $32,000 |
Source: Public Records
Tax History Compared to Growth
Tax History
| Year | Tax Paid | Tax Assessment Tax Assessment Total Assessment is a certain percentage of the fair market value that is determined by local assessors to be the total taxable value of land and additions on the property. | Land | Improvement |
|---|---|---|---|---|
| 2025 | $6,862 | $198,730 | $58,170 | $140,560 |
| 2024 | $6,158 | $126,910 | $40,250 | $86,660 |
| 2023 | $5,903 | $126,910 | $40,250 | $86,660 |
| 2022 | $5,787 | $126,910 | $40,250 | $86,660 |
| 2021 | $5,787 | $126,910 | $40,250 | $86,660 |
| 2020 | $5,575 | $110,460 | $32,340 | $78,120 |
| 2019 | $5,376 | $110,460 | $32,340 | $78,120 |
| 2018 | $5,330 | $110,460 | $32,340 | $78,120 |
| 2017 | $5,044 | $110,460 | $32,340 | $78,120 |
| 2016 | $5,033 | $110,460 | $32,340 | $78,120 |
| 2015 | $5,220 | $129,360 | $36,120 | $93,240 |
| 2014 | $5,187 | $129,360 | $36,120 | $93,240 |
Source: Public Records
Map
Nearby Homes