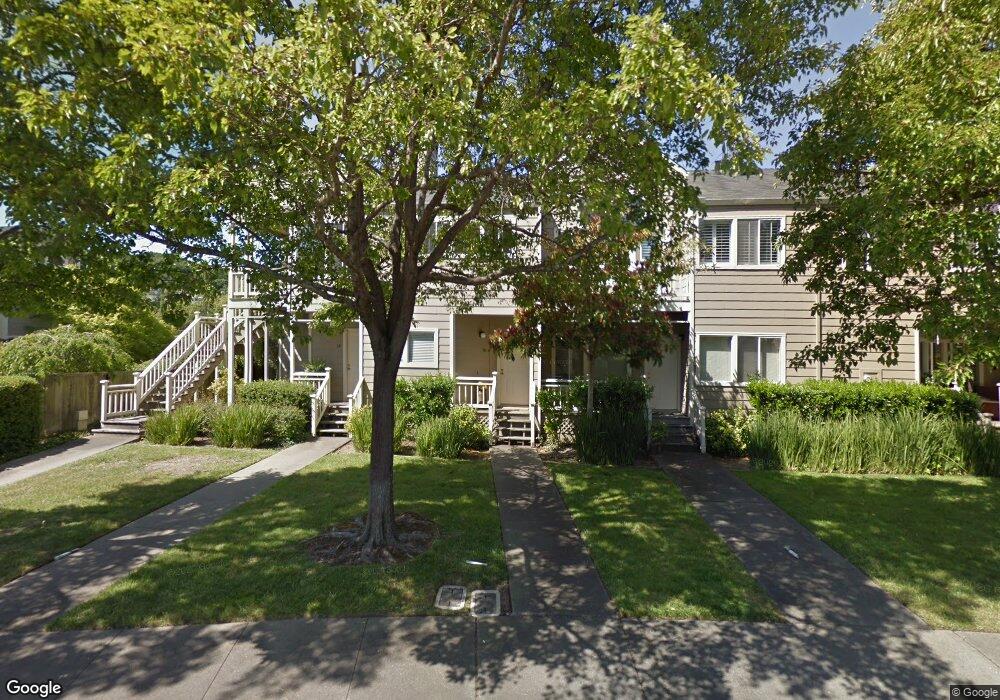
26 Creekside Ct Unit 17 Corte Madera, CA 94925
Estimated Value: $932,761 - $1,391,000
2
Beds
2
Baths
1,246
Sq Ft
$912/Sq Ft
Est. Value
About This Home
This home is located at 26 Creekside Ct Unit 17, Corte Madera, CA 94925 and is currently estimated at $1,136,940, approximately $912 per square foot. 26 Creekside Ct Unit 17 is a home located in Marin County with nearby schools including The Cove School, Hall Middle School, and Redwood High School.
Ownership History
Date
Name
Owned For
Owner Type
Purchase Details
Closed on
May 5, 2009
Sold by
Brodzinsky Hannah
Bought by
Brodzinsky Hannah
Current Estimated Value
Home Financials for this Owner
Home Financials are based on the most recent Mortgage that was taken out on this home.
Original Mortgage
$227,000
Outstanding Balance
$142,339
Interest Rate
4.71%
Mortgage Type
Stand Alone Refi Refinance Of Original Loan
Estimated Equity
$994,601
Purchase Details
Closed on
May 15, 2007
Sold by
Brodzinsky Hannah
Bought by
Brodzinsky Hannah
Purchase Details
Closed on
Sep 2, 1999
Sold by
Margret Ewald and Margret Ewald
Bought by
Brodzinsky Hannah
Home Financials for this Owner
Home Financials are based on the most recent Mortgage that was taken out on this home.
Original Mortgage
$238,000
Interest Rate
7.62%
Create a Home Valuation Report for This Property
The Home Valuation Report is an in-depth analysis detailing your home's value as well as a comparison with similar homes in the area
Home Values in the Area
Average Home Value in this Area
Purchase History
| Date | Buyer | Sale Price | Title Company |
|---|---|---|---|
| Brodzinsky Hannah | -- | Fidelity National Title Co | |
| Brodzinsky Hannah | -- | Fidelity National Title Co | |
| Brodzinsky Hannah | -- | None Available | |
| Brodzinsky Hannah | $328,000 | Pacific Coast Title Company |
Source: Public Records
Mortgage History
| Date | Status | Borrower | Loan Amount |
|---|---|---|---|
| Open | Brodzinsky Hannah | $227,000 | |
| Closed | Brodzinsky Hannah | $238,000 |
Source: Public Records
Tax History Compared to Growth
Tax History
| Year | Tax Paid | Tax Assessment Tax Assessment Total Assessment is a certain percentage of the fair market value that is determined by local assessors to be the total taxable value of land and additions on the property. | Land | Improvement |
|---|---|---|---|---|
| 2025 | $6,633 | $500,715 | $175,250 | $325,465 |
| 2024 | $6,633 | $490,898 | $171,814 | $319,084 |
| 2023 | $6,292 | $481,274 | $168,446 | $312,828 |
| 2022 | $6,253 | $471,838 | $165,143 | $306,695 |
| 2021 | $6,167 | $462,589 | $161,906 | $300,683 |
| 2020 | $6,177 | $457,849 | $160,247 | $297,602 |
| 2019 | $5,866 | $448,873 | $157,105 | $291,768 |
| 2018 | $5,858 | $440,074 | $154,026 | $286,048 |
| 2017 | $5,874 | $431,446 | $151,006 | $280,440 |
| 2016 | $5,647 | $422,989 | $148,046 | $274,943 |
| 2015 | $5,672 | $416,635 | $145,822 | $270,813 |
| 2014 | $5,430 | $408,474 | $142,966 | $265,508 |
Source: Public Records
Map
Nearby Homes
- 64 Parkview Cir
- 17 Sonora Way
- 1411 Casa Buena Dr Unit 14
- 1425 Casa Buena Dr Unit 108
- 58 Sonora Way
- 137 Granada Dr
- 0 Meadowsweet Dr
- 1163 Meadowsweet Dr
- 14 Seawolf Passage
- 929 Meadowsweet Dr
- 34 Fairview Ave
- 160 Golden Hind Passage
- 10 Tanoak Ct
- 801 Meadowsweet Dr
- 51 Laurel Dr
- 16 Tradewind Passage
- 30 Toyon Ct
- 61 N Knoll Rd
- 100 Monterey Dr
- 274 Sausalito St
- 34 Creekside Ct
- 22 Creekside Ct
- 30 Creekside Ct Unit 19
- 38 Creekside Ct
- 18 Creekside Ct
- 40 Creekside Ct
- 14 Creekside Ct
- 21 Creekside Ct
- 10 Creekside Ct
- 42 Creekside Ct
- 6 Creekside Ct
- 11 Creekside Ct
- 44 Creekside Ct
- 2 Creekside Ct
- 23 Creekside Ct
- 25 Creekside Ct
- 65 Parkview Cir
- 89 Parkview Cir
- 27 Creekside Ct
- 59 Parkview Cir