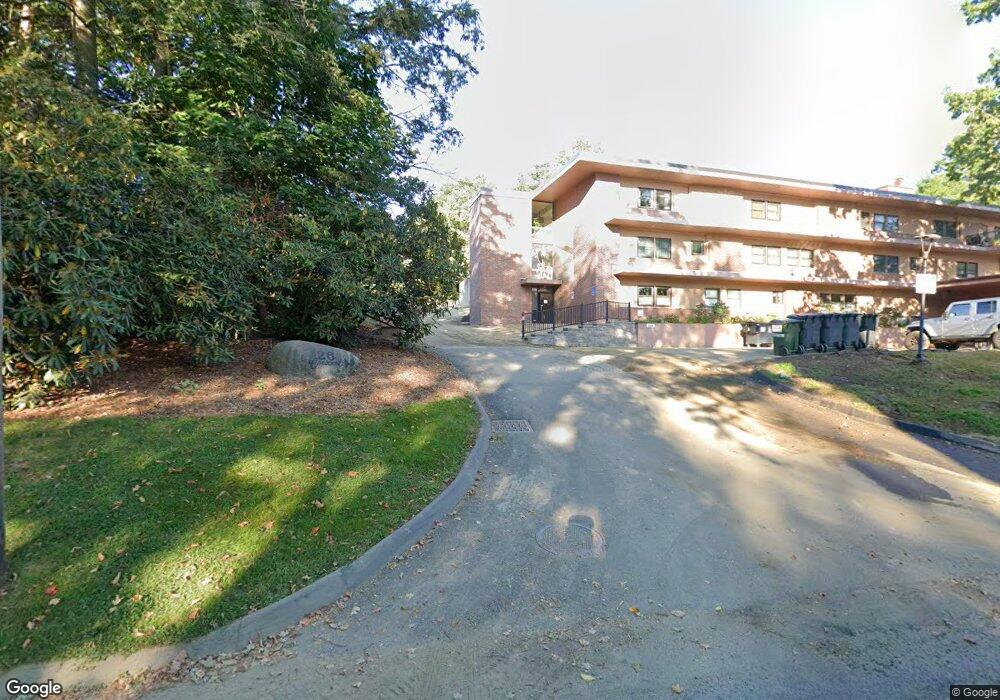
26 Crescent St Unit 2 Northampton, MA 01060
Estimated Value: $337,000 - $454,000
2
Beds
1
Bath
1,715
Sq Ft
$244/Sq Ft
Est. Value
About This Home
This home is located at 26 Crescent St Unit 2, Northampton, MA 01060 and is currently estimated at $417,878, approximately $243 per square foot. 26 Crescent St Unit 2 is a home located in Hampshire County with nearby schools including Northampton High School and Hilltown Cooperative Charter Public School.
Ownership History
Date
Name
Owned For
Owner Type
Purchase Details
Closed on
Mar 27, 2024
Sold by
Welch Edward J
Bought by
Welch Edward J and Lepage Maureen W
Current Estimated Value
Purchase Details
Closed on
Nov 23, 2011
Sold by
Gould Donna M
Bought by
Gould Steven
Purchase Details
Closed on
Nov 6, 2009
Sold by
Walker Susan
Bought by
Gould Steven and Gould Donna
Create a Home Valuation Report for This Property
The Home Valuation Report is an in-depth analysis detailing your home's value as well as a comparison with similar homes in the area
Home Values in the Area
Average Home Value in this Area
Purchase History
| Date | Buyer | Sale Price | Title Company |
|---|---|---|---|
| Welch Edward J | -- | None Available | |
| Gould Steven | -- | -- | |
| Gould Steven | -- | -- |
Source: Public Records
Tax History
| Year | Tax Paid | Tax Assessment Tax Assessment Total Assessment is a certain percentage of the fair market value that is determined by local assessors to be the total taxable value of land and additions on the property. | Land | Improvement |
|---|---|---|---|---|
| 2025 | $4,960 | $356,100 | $0 | $356,100 |
| 2024 | $4,739 | $312,000 | $0 | $312,000 |
| 2023 | $4,942 | $312,000 | $0 | $312,000 |
| 2022 | $5,582 | $312,000 | $0 | $312,000 |
| 2021 | $5,419 | $312,000 | $0 | $312,000 |
| 2020 | $4,032 | $240,000 | $0 | $240,000 |
| 2019 | $3,278 | $188,700 | $0 | $188,700 |
| 2018 | $3,215 | $188,700 | $0 | $188,700 |
| 2017 | $3,149 | $188,700 | $0 | $188,700 |
| 2016 | $3,049 | $188,700 | $0 | $188,700 |
| 2015 | $2,981 | $188,700 | $0 | $188,700 |
| 2014 | $2,904 | $188,700 | $0 | $188,700 |
Source: Public Records
Map
Nearby Homes
- 61 Crescent St Unit 8
- 61 Crescent St Unit 7
- 37 Finn St
- 13A Finn St
- 218 Elm St
- 43 Center St Unit K
- 61 Woodlawn Ave
- 61 Harrison Ave
- 231 Main St Unit 3R
- 25 Union St
- 25 Union St Unit 2
- 50 Union St Unit 18
- 30 Graves Ave Unit B
- 30 View Ave
- 20 View Ave Unit A
- 244 Main St
- 29 Pleasant St Unit 1
- 10 Hawley St Unit 4C
- 10 Hawley St Unit 4D
- 10 Hawley St Unit 1C
- 26 Crescent St Unit 207
- 26 Crescent St Unit 206
- 26 Crescent St Unit 205
- 26 Crescent St Unit 204
- 26 Crescent St Unit 203
- 26 Crescent St Unit 202
- 26 Crescent St Unit 201
- 26 Crescent St Unit 200
- 26 Crescent St Unit 107
- 26 Crescent St Unit 106
- 26 Crescent St Unit 105
- 26 Crescent St Unit 104
- 26 Crescent St Unit 103
- 26 Crescent St Unit 102
- 26 Crescent St Unit 101
- 26 Crescent St Unit 100
- 26 Crescent St Unit 4
- 26 Crescent St Unit 3
- 26 Crescent St Unit 1
- 26 Crescent St Unit G1
Your Personal Tour Guide
Ask me questions while you tour the home.