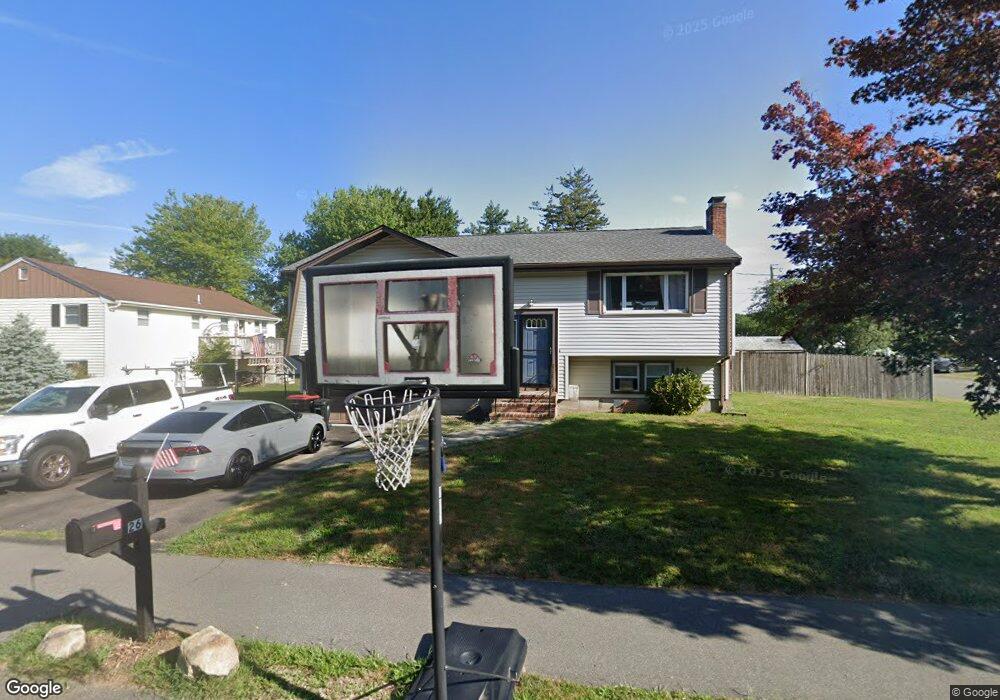
26 Darren Dr Brockton, MA 02301
Brockton Heights NeighborhoodEstimated Value: $548,316 - $586,000
3
Beds
1
Bath
1,596
Sq Ft
$351/Sq Ft
Est. Value
About This Home
This home is located at 26 Darren Dr, Brockton, MA 02301 and is currently estimated at $560,829, approximately $351 per square foot. 26 Darren Dr is a home located in Plymouth County with nearby schools including Hancock Elementary School, Manthala George Jr. School, and Louis F Angelo Elementary School.
Ownership History
Date
Name
Owned For
Owner Type
Purchase Details
Closed on
Feb 13, 2025
Sold by
Hanna William R
Bought by
Hanna Nicole M
Current Estimated Value
Purchase Details
Closed on
Nov 8, 2004
Sold by
Hanna Noriko
Bought by
Hanna William R
Create a Home Valuation Report for This Property
The Home Valuation Report is an in-depth analysis detailing your home's value as well as a comparison with similar homes in the area
Home Values in the Area
Average Home Value in this Area
Purchase History
| Date | Buyer | Sale Price | Title Company |
|---|---|---|---|
| Hanna Nicole M | -- | None Available | |
| Hanna Nicole M | -- | None Available | |
| Hanna William R | -- | -- | |
| Hanna William R | -- | -- |
Source: Public Records
Mortgage History
| Date | Status | Borrower | Loan Amount |
|---|---|---|---|
| Previous Owner | Hanna William R | $25,000 | |
| Previous Owner | Hanna William R | $45,000 |
Source: Public Records
Tax History
| Year | Tax Paid | Tax Assessment Tax Assessment Total Assessment is a certain percentage of the fair market value that is determined by local assessors to be the total taxable value of land and additions on the property. | Land | Improvement |
|---|---|---|---|---|
| 2025 | $6,220 | $513,600 | $147,400 | $366,200 |
| 2024 | $5,814 | $483,700 | $147,400 | $336,300 |
| 2023 | $5,944 | $457,900 | $112,500 | $345,400 |
| 2022 | $5,346 | $382,700 | $102,400 | $280,300 |
| 2021 | $4,966 | $342,500 | $96,500 | $246,000 |
| 2020 | $796 | $328,200 | $92,400 | $235,800 |
| 2019 | $4,749 | $305,600 | $86,700 | $218,900 |
| 2018 | $807 | $269,700 | $86,700 | $183,000 |
| 2017 | $4,358 | $270,700 | $86,700 | $184,000 |
| 2016 | $4,132 | $238,000 | $82,800 | $155,200 |
| 2015 | $4,058 | $223,600 | $82,800 | $140,800 |
| 2014 | $3,985 | $219,800 | $82,800 | $137,000 |
Source: Public Records
Map
Nearby Homes
- 42 Brown St
- 98 Union St
- 990 Pleasant St
- 102 Alandale Ave
- 95 Union St
- LOT 4 Winterberry Ln
- Lot 2 Winterberry Ln
- Lot 1 Winterberry Ln
- 110 Union St
- 86 Union St
- 96 Winterberry Ln
- 197 Candy Ln
- 44 Reservoir St Unit 52
- 23 Winterberry Ln
- 155 Rockland Dr
- 23 Arborway
- 0 Atkinson Ave
- 685 Oak St Unit 129
- 685 Oak St Unit 38
- 685 Oak St Unit 21
Your Personal Tour Guide
Ask me questions while you tour the home.