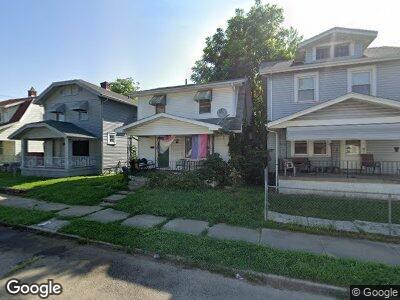
26 Drury St Dayton, OH 45403
Burkhardt NeighborhoodEstimated Value: $41,000 - $113,000
3
Beds
1
Bath
1,056
Sq Ft
$65/Sq Ft
Est. Value
About This Home
This home is located at 26 Drury St, Dayton, OH 45403 and is currently estimated at $68,788, approximately $65 per square foot. 26 Drury St is a home located in Montgomery County with nearby schools including Ruskin Elementary School, Kiser Elementary, and Horizon Science Academy Dayton Downtown.
Ownership History
Date
Name
Owned For
Owner Type
Purchase Details
Closed on
Apr 15, 2021
Sold by
Yeager Harold B and Yeager Cheryl Ann
Bought by
Byerly Keeton Lowell
Current Estimated Value
Purchase Details
Closed on
Oct 11, 2010
Sold by
Yeager Cheryl Ann and Yeager Harold D
Bought by
Yeager Harold D and Yeager Cheryl Ann
Purchase Details
Closed on
Dec 9, 2008
Sold by
Yeager Diane Marie
Bought by
Yeager Cheryl Ann
Home Financials for this Owner
Home Financials are based on the most recent Mortgage that was taken out on this home.
Original Mortgage
$30,000
Interest Rate
6.04%
Mortgage Type
Seller Take Back
Purchase Details
Closed on
Jan 10, 2002
Sold by
Lucid Kathleen M and Devine Michael J
Bought by
Yeager Diane M
Home Financials for this Owner
Home Financials are based on the most recent Mortgage that was taken out on this home.
Original Mortgage
$32,000
Interest Rate
6.3%
Purchase Details
Closed on
Oct 12, 1999
Sold by
Estate Of Phyllis B Lucid
Bought by
Lucid Robert B
Create a Home Valuation Report for This Property
The Home Valuation Report is an in-depth analysis detailing your home's value as well as a comparison with similar homes in the area
Home Values in the Area
Average Home Value in this Area
Purchase History
| Date | Buyer | Sale Price | Title Company |
|---|---|---|---|
| Byerly Keeton Lowell | $16,000 | None Available | |
| Yeager Harold D | -- | Attorney | |
| Yeager Cheryl Ann | -- | None Available | |
| Yeager Cheryl Ann | $30,000 | None Available | |
| Yeager Diane M | $40,000 | Republic Title Agency Inc | |
| Lucid Robert B | -- | -- |
Source: Public Records
Mortgage History
| Date | Status | Borrower | Loan Amount |
|---|---|---|---|
| Previous Owner | Yeager Cheryl Ann | $30,000 | |
| Previous Owner | Yeager Diane M | $32,000 |
Source: Public Records
Tax History Compared to Growth
Tax History
| Year | Tax Paid | Tax Assessment Tax Assessment Total Assessment is a certain percentage of the fair market value that is determined by local assessors to be the total taxable value of land and additions on the property. | Land | Improvement |
|---|---|---|---|---|
| 2024 | $380 | $6,270 | $1,440 | $4,830 |
| 2023 | $380 | $6,270 | $1,440 | $4,830 |
| 2022 | $427 | $5,480 | $1,260 | $4,220 |
| 2021 | $424 | $5,480 | $1,260 | $4,220 |
| 2020 | $424 | $5,480 | $1,260 | $4,220 |
| 2019 | $422 | $4,810 | $1,260 | $3,550 |
| 2018 | $423 | $4,810 | $1,260 | $3,550 |
| 2017 | $420 | $4,810 | $1,260 | $3,550 |
| 2016 | $446 | $5,020 | $1,260 | $3,760 |
| 2015 | $423 | $5,020 | $1,260 | $3,760 |
| 2014 | $423 | $5,020 | $1,260 | $3,760 |
| 2012 | -- | $11,120 | $1,900 | $9,220 |
Source: Public Records
Map
Nearby Homes
- 45 S Sperling Ave
- 90 S Sperling Ave Unit 88
- 28 More Ave
- 112 S Garland Ave
- 3020 E 3rd St
- 3405 E 5th St
- 3411 E 5th St
- 133 Bircher Ave
- 114 N Garland Ave
- 3524 E 5th St
- 3111 E 5th St
- 27 S Quentin Ave
- 2728 E 4th St
- 506 Burkhardt Ave
- 429 Sheridan Ave
- 425 Sheridan Ave
- 235 N Delmar Ave
- 24 S Philadelphia St
- 270 N Garland Ave
- 203 Pleasant Ave Unit 201